"They say the inflation rate has fallen, so why is my grocery basket still expensive?" The news says price growth has slowed, yet the milk or lunch you buy often still costs the same. Neither side is getting it wrong. The inflation rate describes how much prices have changed, while the amount we pay reflects the price increases that have already built up.
To understand this gap, you need to read the "level" of prices and the "rate of increase" separately. Prices rising more slowly and prices that have already risen coming back down are two different changes. Rather than looking only at the fact that a number got smaller, check what was compared with which point in time, and the confusion fades.
The price level is today's height; the inflation rate is the difference between two points in time
The consumer price index combines price changes for the many goods and services households buy. It is not a direct readout of one shop's price tags or one person's monthly living costs. It gathers many items and reflects each one's share of consumer spending to show the overall movement of prices.
An index is a scale for comparing price levels at different points in time. If the base is set at 100, an index of 105 means a level 5% higher than that base. 100 does not mean 100 won, and if the base changes, the displayed index numbers can change too. That is why comparisons are only meaningful between indices compiled on the same base.
The inflation rate is the percentage by which the index has changed from the comparison point. The formula is "(current index − comparison index) ÷ comparison index × 100." The index shows the height reached now, and the rate shows by what percentage the height changed between two points in time. Even if the height keeps rising, the size of each rise can shrink.
100 → 105 → 107.1: checking it with numbers
Now let us look at a hypothetical example, not actual published statistics. We compare the price index for the same month each year and set the index at the starting point to 100. If the index is 105 a year later, the calculation is "(105−100)÷100×100," and the increase from the same month of the previous year is 5%.
Suppose the rate for the following year falls to 2%. In the second year, the comparison is not with the original 100 but with the 105 of a year earlier. The index therefore becomes "105×1.02=107.1." The rate fell from 5% to 2%, but the index itself rose further, from 105 to 107.1.
Comparing the initial 100 with the final 107.1 shows a cumulative rise of 7.1% over two years. The reason it differs slightly from 7%, the simple sum of 5% and 2%, is also that the base for the second rate is 105. What matters here is not a complicated calculation method but what is being compared. The statement "prices rose 2%" always carries the condition "from the level at which point in time."
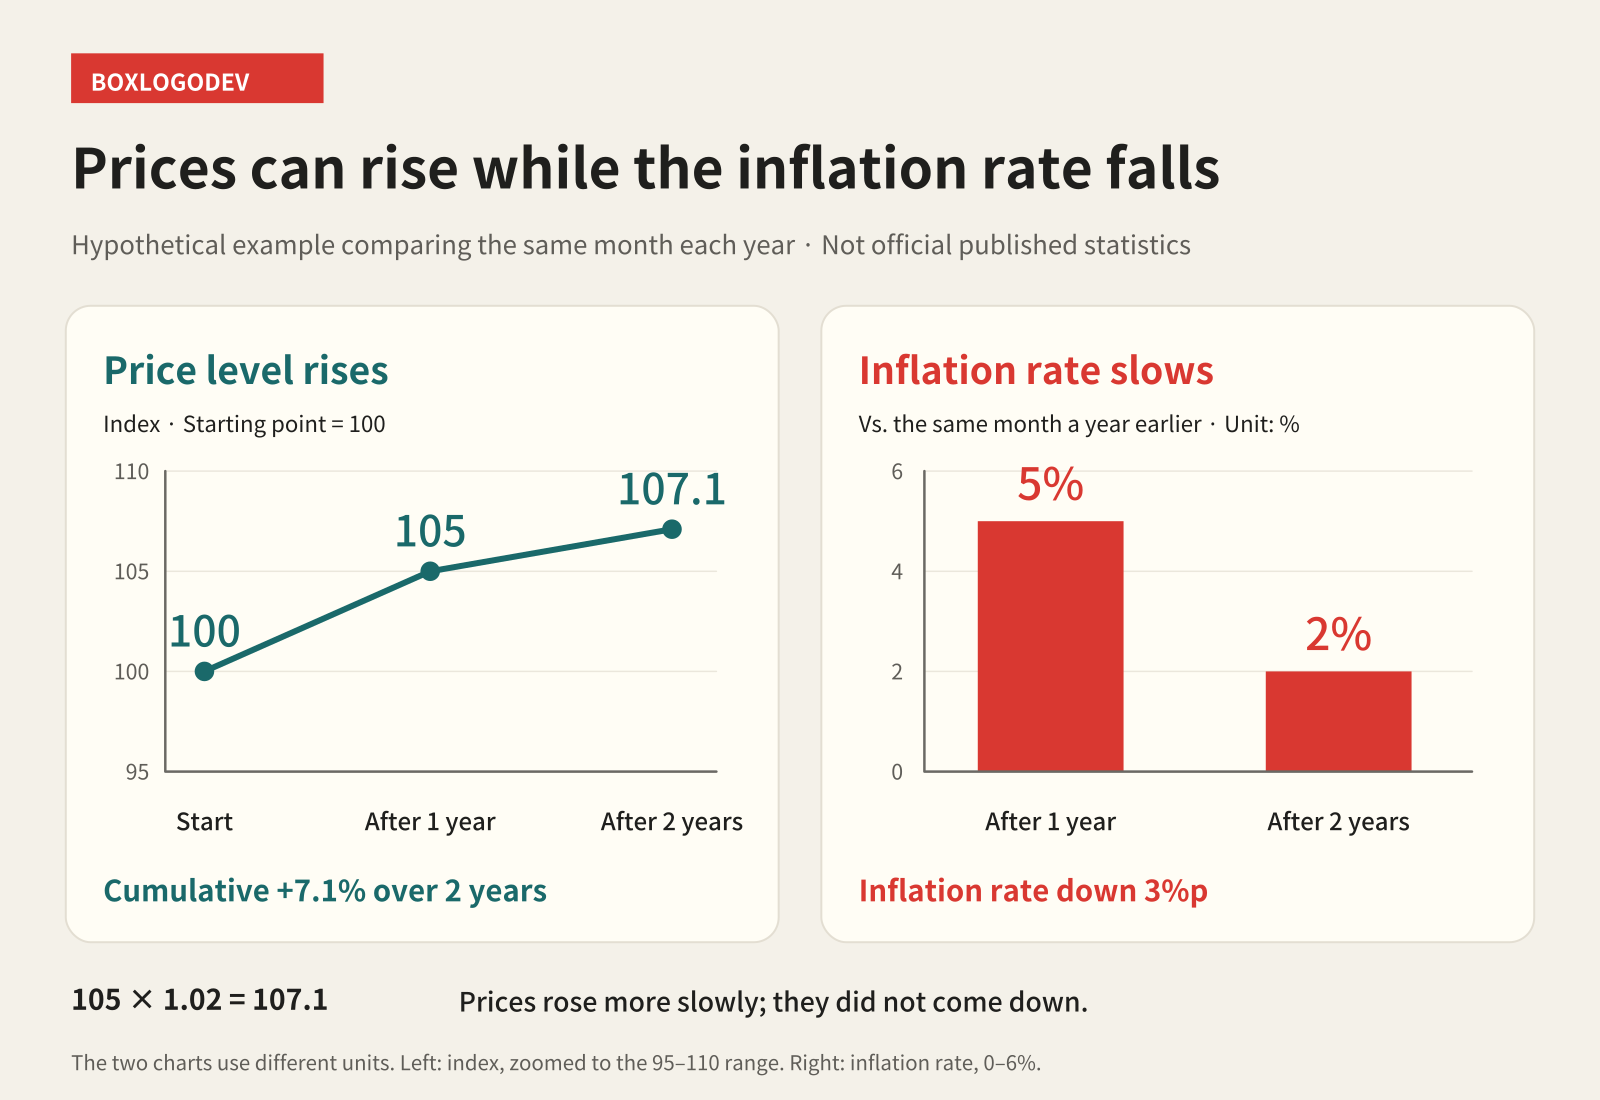
In the figure, the teal line on the left shows the price level continuing to rise, and the red bars on the right show the inflation rate falling. Although the two charts point in different directions, they describe the same situation. The left is an index and the right is a percentage, and their vertical axes use different units. Do not read the lower bar as meaning the index on the left came down too.
What "the inflation rate fell 3 percentage points" means
The difference between 5% and 2% is 3 percentage points. You cannot restate this as "prices fell 3%." What differs is not the direction of price change but the size of the rate of increase. In this example, the price level still rose 2% in the second year. You need to tell whether the word "decline" in the news refers to the index or to the rate.
If the rate for the same comparison period is 0%, the index is at the same level as at the comparison point. That does not mean the prices that rose over the past year have been returned to an earlier starting point. In the example above, if the rate is 0% in the year after the index reaches 107.1, the index is still 107.1. Not rising is different from becoming cheaper than before.
A negative rate means the index is lower than at that comparison point. But this, too, does not mean it is lower than at every past point in time. A 1% decline from 107.1 gives "107.1×0.99=106.029," or about 106.03 to two decimal places. That is lower than the year before, but still higher than the initial 100. Even when prices fall, you have to look at the reference point as well.
Prices can be lower than a month ago yet higher than a year ago
Month-on-month figures compare with the previous month, and year-on-year figures compare with the same month of the previous year. Even when the same index for this month is used, the starting points differ, so the results can have different signs. A statement that the month-on-month change is negative and a statement that the year-on-year change is positive can therefore both be true at once.
As a separate hypothetical example, suppose last month's index was 108 and this month's index is 107.1. The month-on-month change is "(107.1−108)÷108×100," or about −0.83%. But if the index for the same month last year was 105, the year-on-year change is "(107.1−105)÷105×100," or 2%. Prices fell over the most recent month, yet they are higher than a year ago.
Care is also needed when an inflation rate is described as "prices rose 2% this month." If that 2% is a year-on-year figure, it does not mean prices rose 2% within a single month. When you see a figure in an article or chart, first check whether the percentage says "vs. the previous month" or "vs. the same month last year," and you will be less likely to compare different figures by mistake.
Why overall prices and your own grocery basket can feel different
The overall index combines the movements of many items. Even if some items get cheaper, the overall index can rise if other items get more expensive. Items are also not given equal weight. A few unchanged price tags do not mean overall prices have stopped rising, and a lower overall inflation rate does not mean every price tag comes down with it.
Households also spend their money in different proportions. A household whose spending is concentrated on groceries and eating out may feel changes differently from one with a large share of transport or housing costs. There is no need to treat either side as wrong just because the overall average differs from your own spending experience.
Receipt totals and the inflation rate do not map directly onto each other either. The amount you pay mixes price with changes in the quantity bought and in the mix of products. If you bought more than last month or chose different products, you cannot call the whole increase in the total a price rise. Comparing the same item, the same size and the same quantity lets you separate the change in price itself more clearly.
When you read news about prices, check three things together: whether the number is an index level or a rate of increase, what the comparison point is, and whether it is the overall index or a specific item. News that the inflation rate has fallen tells you about the speed of price changes. Whether living costs that have already risen have returned to their earlier level can only be known by looking separately at the price level and at the prices of the items you actually buy.