The Bank of Korea’s release of 29 September 2026, Business Survey Index and Economic Sentiment Index for September 2026 (in Korean), puts two numbers moving in opposite directions side by side. The all-industry Composite Business Sentiment Index (CBSI) fell 0.5 points, from 99.6 to 99.1. The Economic Sentiment Index (ESI) rose 0.5 points, from 99.4 to 99.9. Both are “sentiment” indicators from the same institution on the same day, yet one headline can say business confidence slipped while another says sentiment improved.
Neither is wrong. The two indices are built from different questions. After reading this you will be able to tell what each one measures, and at the next release you can open the contribution table in the press release and see for yourself which items moved the index.
The two indices collect different questions
The starting point is the Business Survey Index (BSI). Every month the Bank of Korea asks incorporated firms across the country about items such as business conditions, production and their financial position. It takes the share of firms saying “better”, subtracts the share saying “worse” and adds 100. A BSI therefore runs from 0 to 200, and above 100 means more firms answered positively than negatively. The September survey covered 3,524 firms between 10 and 17 September, and 3,163 of them responded.
The CBSI combines nine of these BSIs: business conditions, production, new orders, finished-goods inventories and financial position for manufacturing, and business conditions, sales, profitability and financial position for non-manufacturing. All nine are this month’s results. The ESI starts from different items. On the business side it uses five outlooks for next month: manufacturing exports, operating rate and financial position, and non-manufacturing business conditions and financial position. To these it adds two questions from the Consumer Survey: the household income outlook and the consumer spending outlook. The business items are weighted 0.15 each and the consumer items 0.125 each.
ECONOMY NOTES
Same survey, different baskets
Which questions each index uses, and for which month
CBSI: this month's results
- Firms only
- Manufacturing, 5: conditions, production, new orders, inventories, finance
- Non-manufacturing, 4: conditions, sales, profitability, finance
ESI: outlook for next month
- Weighted average of 7 firm and consumer items
- Manufacturing outlook for exports, operating rate, finance: 0.15 each
- Non-manufacturing outlook for conditions, finance: 0.15 each
- Consumers' household income and spending outlook: 0.125 each
In common: 100 is the long-run average
- Each item is standardised with its 2003-2025 mean and standard deviation
- Above 100 is more optimistic than the past average, below 100 less
Source: Bank of Korea, Business Survey Index and ESI for September 2026, Appendices 2-3 (29 September 2026)
The two have one thing in common. Each item is standardised with its own mean and standard deviation over 2003 to 2025 before it is combined, and the long-run average is set to 100. Above 100 reads as more optimistic than the past average, below 100 as less. In the release’s appendix the Bank of Korea says it designed the CBSI around the current conditions firms feel, and the ESI around the outlook of consumers and firms.
In September, different items moved
The release publishes each item’s contribution, so both numbers can be taken apart. Start with the CBSI. Manufacturing fell 4.3 points, from 103.8 to 99.5. The biggest drag was finished-goods inventories (−1.8). That BSI rises when more firms report excess stock, so it is an inverse series: its rise from 100 to 103 enters the index as a negative. New orders (92 to 87, −1.0), production (92 to 89, −0.6), business conditions (81 to 79, −0.5) and financial position (82 to 81, −0.4) all fell too. Non-manufacturing went the other way, up 2.2 points from 96.7 to 98.9, lifted by financial position (+1.0), business conditions (+0.7) and profitability (+0.5), with sales unchanged. Put together, the all-industry CBSI fell 0.5 points.
Of the seven ESI items, only three moved in September. The manufacturing export outlook BSI dropped from 97 to 94, contributing −0.4. Consumers’ household income outlook CSI rose from 100 to 102, contributing +0.6, and the spending outlook CSI rose from 109 to 110, contributing +0.3. The other four outlooks were the same as the month before and contributed 0.0. −0.4 + 0.6 + 0.3 = +0.5, exactly the rise in the ESI.
ECONOMY NOTES
Splitting September's −0.5 and +0.5
Contributions published by the Bank of Korea, in points
Manufacturing CBSI 103.8 → 99.5 (−4.3)
- Inventories −1.8 · new orders −1.0 · production −0.6
- Conditions −0.5 · finance −0.4
Non-manufacturing CBSI 96.7 → 98.9 (+2.2)
- Finance +1.0 · conditions +0.7 · profitability +0.5 · sales 0.0
- All-industry CBSI: 99.6 → 99.1 (−0.5)
ESI 99.4 → 99.9 (+0.5)
- Manufacturing export outlook 97 → 94: −0.4
- Household income outlook 100 → 102: +0.6
- Spending outlook 109 → 110: +0.3
- The other four items unchanged: 0.0
- −0.4 + 0.6 + 0.3 = +0.5
Source: Bank of Korea release (29 September 2026) pp. 2-3 and 8; ECOS 512Y014 and 511Y002 (retrieved 10 October 2026). Inventories are an inverse series: more stock lowers the index.
So September’s split came about like this. The manufacturing results for inventories, orders and production that pulled the CBSI down are not part of the ESI. The two consumer items that pushed the ESI up are not part of the CBSI. The indices share a source, the same business survey, but not the questions or the month they refer to.
A point does not weigh the same everywhere
One more thing stands out. The export outlook fell 3 points but contributed only −0.4, while the household income outlook rose just 2 points and contributed +0.6. Weights do not explain this; the export outlook’s weight (0.15) is actually larger than the household income outlook’s (0.125).
The difference comes from standardisation. Each item is divided by its historical standard deviation before the items are combined, so a point in an item that usually swings a lot weighs little, and a point in a calm item weighs a lot. The release does not publish each item’s mean and standard deviation, so the exact calculation cannot be reproduced. But dividing the published contributions for March to September 2026 by the index moves gives a steady pattern: about 0.1 to 0.15 per point for the export outlook, and around 0.3 for the household income outlook. The figure below shows the same principle with made-up numbers.
ECONOMY NOTES
Hypothetical: fewer points, higher composite
Made-up numbers for illustration, not Bank of Korea parameters
Volatile indicator A
- Mean 90, standard deviation 15
- 90 → 87, down 3 points
- Standardised change −3 ÷ 15 = −0.2
Calm indicator B
- Mean 100, standard deviation 5
- 100 → 102, up 2 points
- Standardised change +2 ÷ 5 = +0.4
Combine with equal weights of 0.5
- Raw points: −3 + 2 = −1
- Composite change: 0.5 × (−0.2) + 0.5 × 0.4 = +0.1
- The calm indicator's 2 points weigh more
The real index rescales this sum so that its long-run average is 100; this example skips that step.
Indicator A falls 3 points and indicator B rises 2, so the raw points add up to −1. If A’s standard deviation is 15 and B’s is 5, the standardised changes are −3 ÷ 15 = −0.2 and +2 ÷ 5 = +0.4, and with weights of 0.5 each the composite moves +0.1. Fewer points, yet the composite rises. The real index then rescales the sum so that its long-run average is 100, but the reason the direction flips is already settled at this step.
Placing September in this year’s trend
Month on month they split, but from January 2026 both indices stayed below 100 all year and climbed together after the spring. The CBSI rose from 94.0 in January to 99.6 in August before easing in September. The ESI bottomed at 91.7 in April and climbed to 99.9 in September. Both numbers say the same thing about the level: still slightly more pessimistic than the past average.
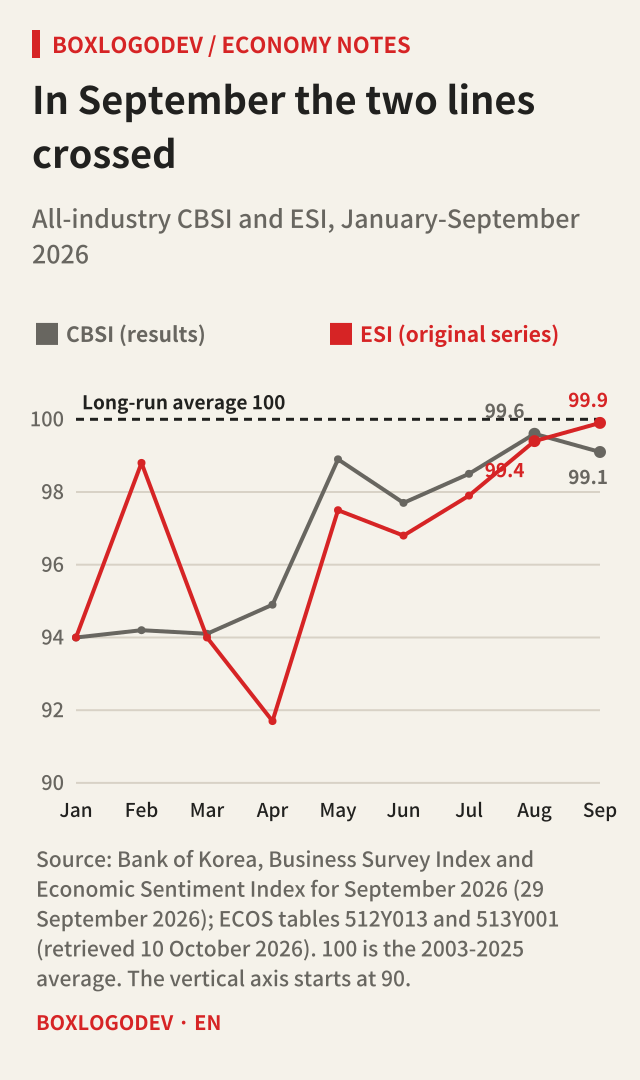
The monthly original series swings with seasons and one-off factors. The ESI cycle component, which the Bank of Korea publishes alongside, rose 0.7 points to 98.3 in September and, on current estimates, has risen for eight straight months from 95.0 in January. Because seasonal and irregular factors are re-estimated every month, though, its whole history can be revised. Nor do moves in sentiment indicators announce what output or consumption will do.
Three steps for the next release
The October Business Survey and ESI are scheduled for 29 October. If the two numbers split again, try reading them in this order. First, check which index it is. The CBSI gathers firms’ results for this month; the ESI gathers firms’ and consumers’ outlook for next month, and they answer different questions. Second, separate level from change. 99.9 is a number that has both “risen” and “is still below 100”. Third, open the contribution table in the release and count how many items moved. If, as in September, only three of seven did, those three items tell you more than the headline number.
When the two indices move in opposite directions there is no need to pick one. September’s numbers are most accurate read together: manufacturers saw weaker results in September, while consumers’ outlook for next month’s household finances improved a little.
Add your perspective.
Share a question, another approach, or something you have tried.
Checking sign-in…
Loading comments…