In Industrial Activity Trends, August 2026 (in Korean), released by Korea's Ministry of Data and Statistics on 30 September 2026, all-industry output fell 1.3% from the previous month, retail sales fell 1.8% and facility investment fell 9.5%. It was the month of "production, consumption and investment all down" headlines. Yet the last line of the same release says the cyclical component of the coincident composite index, the measure meant to show current business conditions, rose 0.5 points to 101.7.
Neither number is wrong. They cover different indicators, treated in different ways and reported in different units. After reading this you will be able to trace such a gap from the component table in the release alone, and explain why 0.6% and 0.5 points are different numbers.
The seven indicators inside the coincident index
The Bank of Korea's glossary of 800 economic and financial terms (2026, pp. 13 and 102) describes the composite indexes as a selection of economic indicators that are stripped of seasonal and irregular factors, put on a common amplitude and then combined into one index. The coincident index, which moves with the economy now, has seven ingredients: mining and manufacturing output, service output excluding wholesale and retail, construction completed, retail sales, domestic shipments, imports, and non-farm employment. Imports are divided by the dollar-based import price index so they track volume more closely.
That already explains part of the gap. Facility investment, which stood out with its 9.5% fall, is not a component of the coincident index. Imports and domestic shipments, which rarely make the headlines, are in it, and they rose 2.5% and 1.1% in August.
ECONOMY NOTES
Same August, two month-on-month figures
Headlines use seasonally adjusted changes; the index uses changes with irregular factors removed too
Mining and manufacturing output
- Headline (seasonally adjusted): −4.8%
- Coincident index component: +0.7%
- The month car output fell 24.8%
Retail sales
- Headline −1.8% → component −0.6%
- The only one of seven components to fall
Facility investment
- Headline −9.5%
- Not a coincident index component
The other components
- Imports +2.5% · domestic shipments +1.1%
- Construction completed +1.6% · employment +0.3%
Source: Ministry of Data and Statistics, Industrial Activity Trends, August 2026 (30 September 2026), pp. 2–5 and 38. August values are preliminary.
The same output index: −4.8% and +0.7%
A larger difference sits inside a single indicator. The headline mining and manufacturing output figure, seasonally adjusted, fell 4.8% from July. Car production, down 24.8%, weighed most, and at the release briefing the ministry pointed to carmakers' summer holidays being concentrated in early August. Yet on page 38 of the release, in the table of coincident index components, the August change in mining and manufacturing output is +0.7%.
The note under the table gives the reason: component changes are figures with irregular factors removed as well as seasonal ones, so they differ from the changes in the original or seasonally adjusted series. The methodology appendix says the composite index is built by seasonal adjustment followed by a 3–4 month trailing moving average to remove irregular factors. A trailing average takes the latest few months up to the current one, so a dip that happens in one month alone becomes shallower inside the average.
ECONOMY NOTES
How an average fills a one-month dip
A fictional output index · the idea, with a simple 3-month average
Fictional index
- 100 → 100 → 100 → 94 → 100
- Holiday month −6.0%, next month +6.4%
Latest 3-month average
(100 + 100 + 94) / 3 = 98.0- Months 3–5: 100.0 → 98.0 → 98.0
- Month-on-month −2.0%, then 0.0%
The difference
- A −6.0% shock shrinks to −2.0%
- and the +6.4% rebound disappears
- The real method: seasonal adjustment, then a 3–4 month trailing average
All numbers are a fictional example. The release does not give the official weights, so a simple average stands in.
In the fictional example, an index that drops 6% for one month and then recovers lowers its latest 3-month simple average by only 2%, and the rebound the next month does not show. The release does not give the weights and detailed steps used in practice, so this simple average cannot reproduce the published +0.7%. It only shows why a shock bunched into one month, such as a holiday, carries less weight. Retail sales went through the same treatment: −1.8% in the headline became −0.6% as a component.
What dividing by volatility reveals
The component table has one more column, labelled volatility: each indicator's standard deviation of monthly changes from 2010 to 2025. To put an indicator that usually swings widely and one that barely moves on the same scale, it is natural to divide each change by that indicator's usual swing. That is the idea behind the "standardisation of amplitude" the glossary mentions.
You can do the division with the published numbers. Employment gives 0.3 ÷ 0.219 = 1.37 and construction completed gives 1.6 ÷ 1.473 = 1.09, so a 0.3% rise in employment is a bigger signal than a 1.6% rise in construction. Across all seven: imports 2.16, domestic shipments 1.43, employment 1.37, construction 1.09, manufacturing 0.78, services 0.20 and retail sales −0.77. Six are positive and only retail sales is negative. That matches the release's own summary, which says retail sales fell while imports, domestic shipments and others rose.
ECONOMY NOTES
0.3% from a quiet indicator is a loud signal
August component change ÷ volatility (2010–2025 standard deviation)
Inputs: published change and volatility
- Imports 2.5 / 1.158 · shipments 1.1 / 0.771
- Employment 0.3 / 0.219 · construction 1.6 / 1.473
- Manufacturing 0.7 / 0.901 · services 0.1 / 0.512
- Retail sales −0.6 / 0.775
Divide (rounded to two decimals)
0.3 / 0.219 = 1.37- Imports 2.16 · shipments 1.43 · employment 1.37
- Construction 1.09 · manufacturing 0.78 · services 0.20
- Retail sales −0.77
How to read it
- Here employment +0.3% outweighs construction +1.6%
- Six positives; retail sales is the only negative
- The official synthesis adds further steps: +0.6%
Inputs: Industrial Activity Trends, August 2026, p. 38. The division is this article's calculation, not the official aggregation formula.
This division is an illustration, not the official aggregation formula. A simple average of the seven raw changes is 0.81% and of the divided values 0.89, but the published coincident index rose 0.6%. The official synthesis has further adjustment steps, so the result differs. What the calculation gives you is a feel for the direction and the size of each contribution.
0.6% and 0.5 points are different units
The coincident index itself is set to 100 in 2020 and rose from 118.1 in July to 118.8 in August. 118.8 ÷ 118.1 = 1.0059, a 0.6% rise. The cyclical component is that index with its long-run trend removed; the ministry says it extracts the trend with the phase-average trend method (PAT). 100 is the trend level, so 101.7 means above trend. Changes in this measure are written in points, not percent: from 101.2 to 101.7 is 0.5 points.
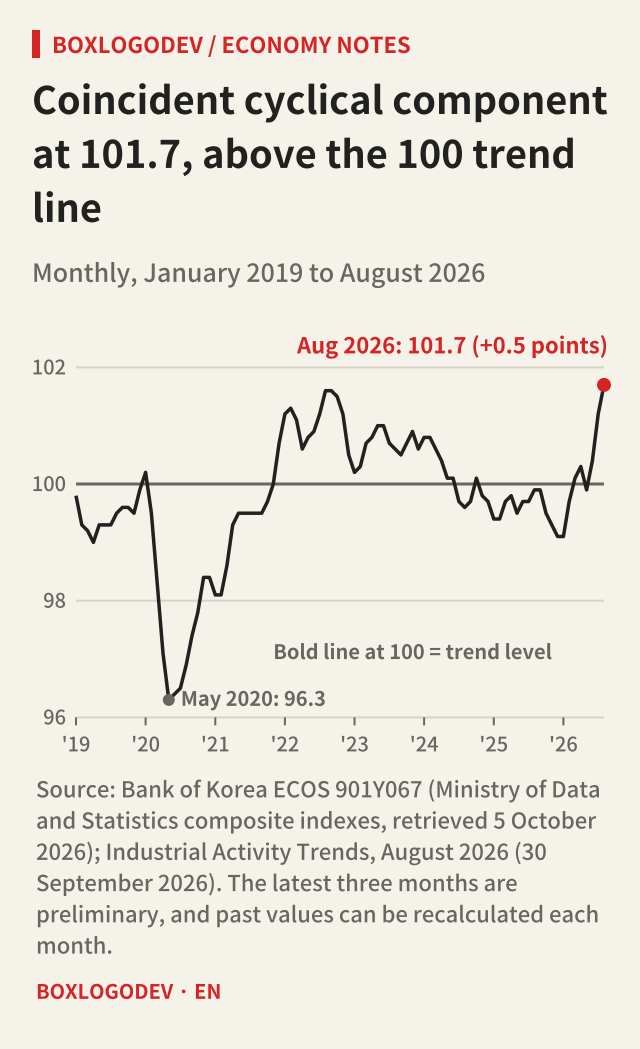
In the series retrieved from the Bank of Korea's ECOS on 5 October 2026, 101.7 is the highest value since January 2010, and May 2020's 96.3 is the low of that period. The latest three months of the coincident index are preliminary, however, and the ministry advises that the most recent two to three years of the cyclical component are estimates. The same guidance says phases are judged by whether the indicator moves in one direction for roughly two quarters or more, so a single month's 0.5 points is too early to call a phase. In the same release, the leading index's cyclical component, which signals the phase ahead, fell 0.1 points to 104.2.
Where to look first in the next release
September's Industrial Activity Trends is scheduled for 30 October. If the headlines and the cyclical component diverge again, the quickest route is the coincident index component table in the release, not the news story. Count the signs of the seven component changes, divide by volatility to see which ones really moved, and where a component differs sharply from its headline, look for something bunched into one month. With those three checks you can explain for yourself why "triple decline" and "business conditions up" arrived on the same day.
Add your perspective.
Share a question, another approach, or something you have tried.
Checking sign-in…
Loading comments…