In Consumer Price Trends, September 2026 (in Korean), released by Korea's Ministry of Data and Statistics on 2 October 2026, the consumer price index stood at 120.43, up 0.3% from August. Yet the rise compared with a year earlier fell from 3.1% in August to 2.9% in September, 0.2 percentage points lower. Prices went up during the month, and the headline still said inflation had eased.
Neither number is wrong. What pulled September's rate down was not this September but last September. After reading this you will be able to rebuild 2.9% yourself from four published index values, and when the next inflation figure comes out you will be able to separate the part of the move that belongs to "the same month last year".
A year-on-year rate bundles twelve monthly moves
The inflation rate in the news is usually the year-on-year rate: this month's index divided by the index for the same month a year earlier. Everything that happened in the twelve months in between is multiplied into it. September's 2.9% chains together the monthly changes from October 2025 to September 2026; August's 3.1% covers September 2025 to August 2026.
Each month this twelve-month window slides one step. One new month comes in and one month from a year ago drops out. So the year-on-year rate moves for two reasons: how much prices moved this month, and how much they moved in the month that left the window. If that month a year ago saw an unusually large rise, this year's rate looks low; if it saw a fall, this year's rate looks high.
The Bank of Korea's glossary of 800 economic and financial terms calls this the base effect: an indicator looks inflated or depressed because of conditions at the point it is compared with. An extreme fictional example makes it plain.
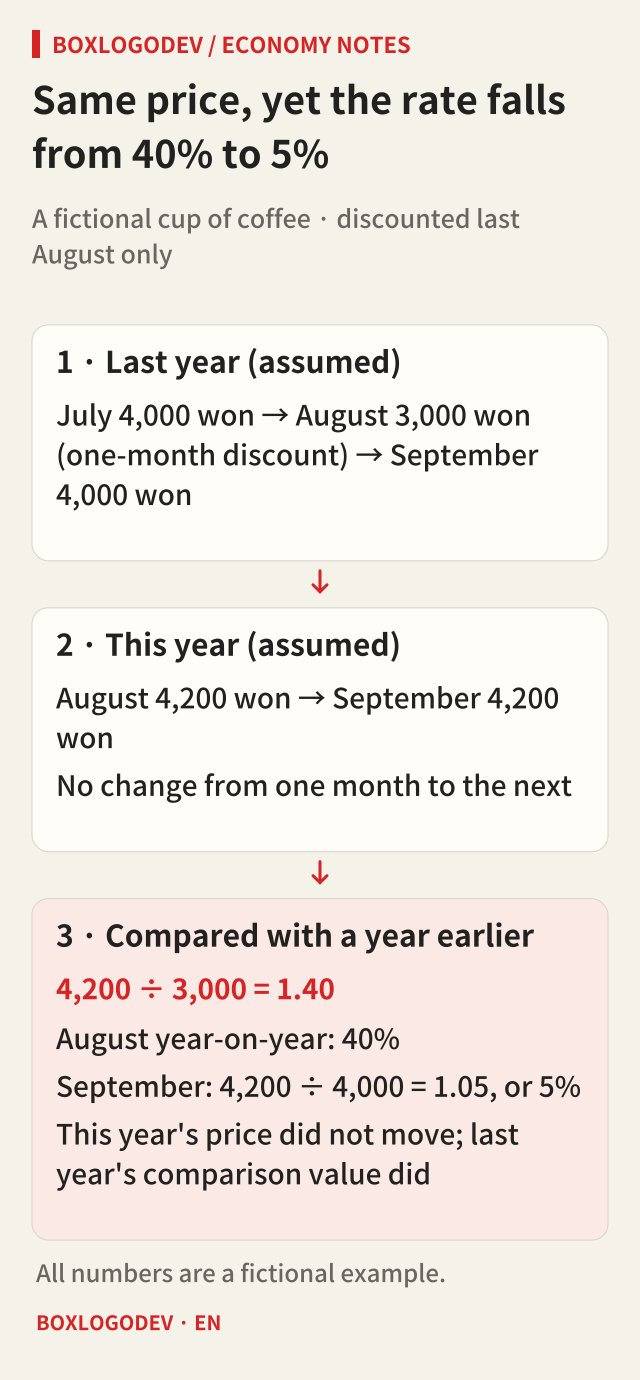
Picture a coffee that was discounted for one month, last August only. This year it costs 4,200 won in both August and September. Compared with a year earlier, though, August works out 40% higher than 3,000 won, and September 5% higher than 4,000 won. This year's price did not move, yet the rate dropped 35 percentage points. Only the comparison value from last year changed.
Rebuilding September's 2.9% from four index values
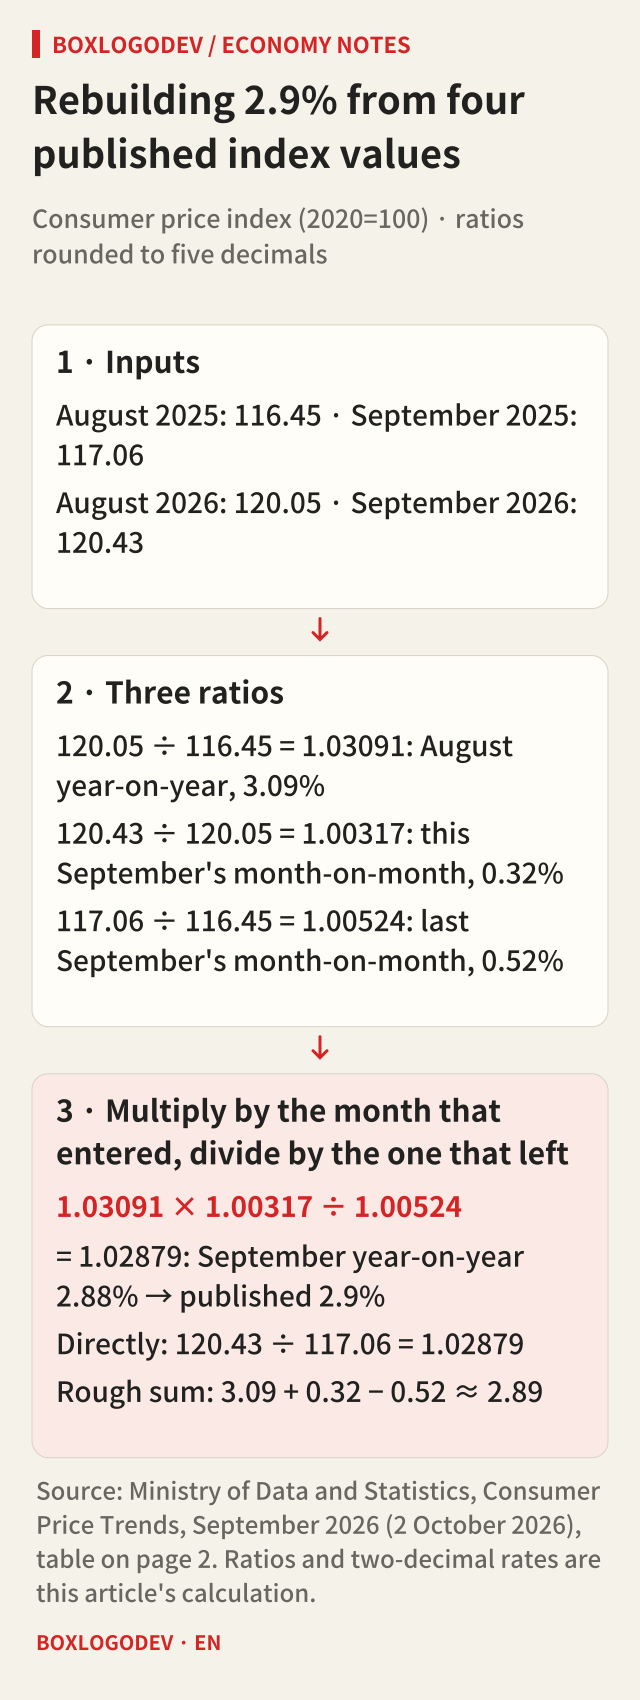
Now with the real numbers. The table on page 2 of the release has every index value needed (2020=100): 116.45 for August 2025, 117.06 for September 2025, 120.05 for August 2026 and 120.43 for September 2026.
August's year-on-year ratio is 120.05÷116.45=1.03091, or 3.09%. This September's one-month rise is 120.43÷120.05=1.00317, or 0.32%, and last September's was 117.06÷116.45=1.00524, or 0.52%. Take last September out of the twelve-month window and put this September in: 1.03091×1.00317÷1.00524=1.02879, or 2.88%. Dividing 120.43 by 117.06 directly gives the same 1.02879, which rounds to the published 2.9%.
While rates are small, a rough sum is good enough: last month's rate, plus this month's month-on-month change, minus the month-on-month change of the same month last year. 3.09+0.32−0.52=2.89, within 0.01 points of the exact 2.88. Prices did rise this September, but not as much as they did last September (0.52%), and that is why the year-on-year rate fell 0.21 points.
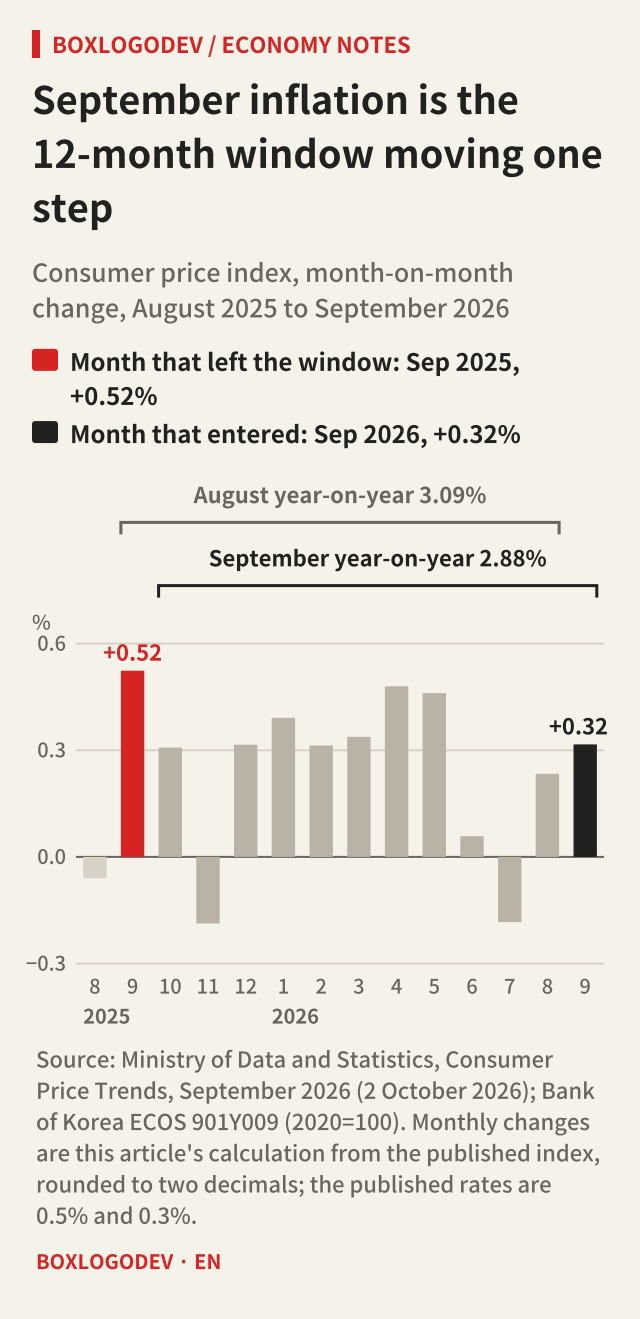
The chart below shows each month's change from August 2025 to September 2026 as a bar, with brackets marking the twelve months behind the August and September year-on-year rates. The red bar is the month that left the window; the black bar is the month that came in.
August's 3.1% also came from last year
Run the same calculation one month earlier and it shows why August jumped from July's 2.8% to 3.1%. In August 2025 the index fell 0.1% from July. With a negative month leaving the window, even a 0.2% rise this August was larger than what dropped out, so the year-on-year rate went up.
Last August's fall came mainly from communication. The August 2025 release shows the communication index down 13.3% in one month, with mobile phone charges down 21.0% among individual items. That fall pulled the headline index down by 0.58 points that month. In September 2025 the communication index rose 15.4% and returned to its earlier level.
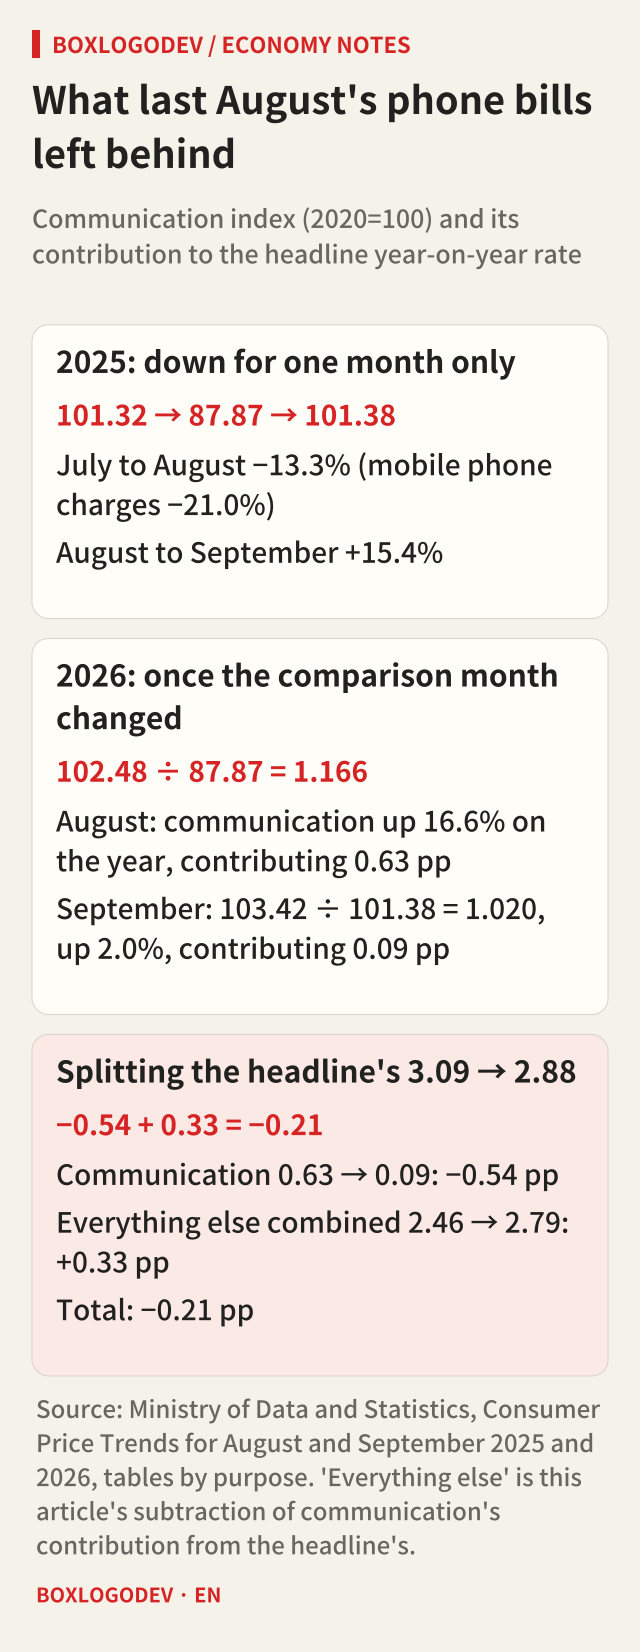
As a result communication's year-on-year rate jumped to 16.6% this August and came back to 2.0% in September. Its contribution to the headline year-on-year rate was 0.63 points in August and 0.09 points in September. The headline's contributions fell from 3.09 to 2.88, down 0.21 points; communication alone took off 0.54 points, while everything else combined added 0.33. Reading September's lower rate only as a sign that prices are calming in general misses this. The release itself also notes that petroleum products were 14.8% higher than a year earlier.
Core inflation shows the same pattern. The index excluding food and energy rose 3.4% year on year in August and 2.8% in September, 0.6 points lower. That index rose 0.5% during September last year and fell 0.1% during September this year. Roughly: 3.4−0.1−0.5=2.8.
How to filter out the base effect
When a report says the year-on-year rate has changed, check three things in turn. First, this month's month-on-month change. The release's own notes say that trends are mainly read year on year but that the short-term month-on-month change should be consulted too. Second, the month-on-month change of the same month last year. The table on page 2 of the same release lists thirteen months side by side, so there is nothing extra to look up. The difference between this month's and last year's month-on-month change accounts for most of the change in the year-on-year rate. Third, if that difference comes from a particular group of items, find it in the contribution table by spending purpose.
This is not a forecasting tool. What you can know in advance is which month will leave the window. Calculated from the published index, the month-on-month change was 0.31% in October 2025, −0.19% in November and 0.32% in December. If prices rise 0.31% during October this year, for example, October's year-on-year rate comes out almost the same as September's; a bigger rise lifts it and a smaller one lowers it. Since last November was negative, the year-on-year rate rises slightly in November even if prices simply stay flat that month. What actually happens depends on that month's prices.
In short, the month-to-month change in a year-on-year rate is roughly "this month's month-on-month change minus the same month's change last year". When the next inflation release moves the rate, use that subtraction first to see whether the number is telling you about this year or about last year.
Add your perspective.
Share a question, another approach, or something you have tried.
Checking sign-in…
Loading comments…