In the Bank of Korea's 2024 Input-Output Tables (extended), released on 21 September 2026, the economy-wide production inducement coefficient for 2024 was 1.808. When final demand for domestic goods rises by 100 million won, output across all industries in Korea rises by 180.8 million won. Does gross domestic product (GDP) rise by 180 million won as well? It does not. In the same table the value added inducement coefficient is 0.759.
After reading this you will be able to say what the production inducement coefficient counts, and why the value added and import inducement coefficients always add up to 1. You can also recompute 1.808 yourself from three numbers in the tables the Bank of Korea published with the release.
Orders travel upstream and shrink
An input-output table records, in one matrix, what each industry bought and used during a year, what it produced, and to whom it sold its output. Final demand is spending that is not processed further, such as consumption, investment and exports; intermediate inputs are the materials and services used to make other products.
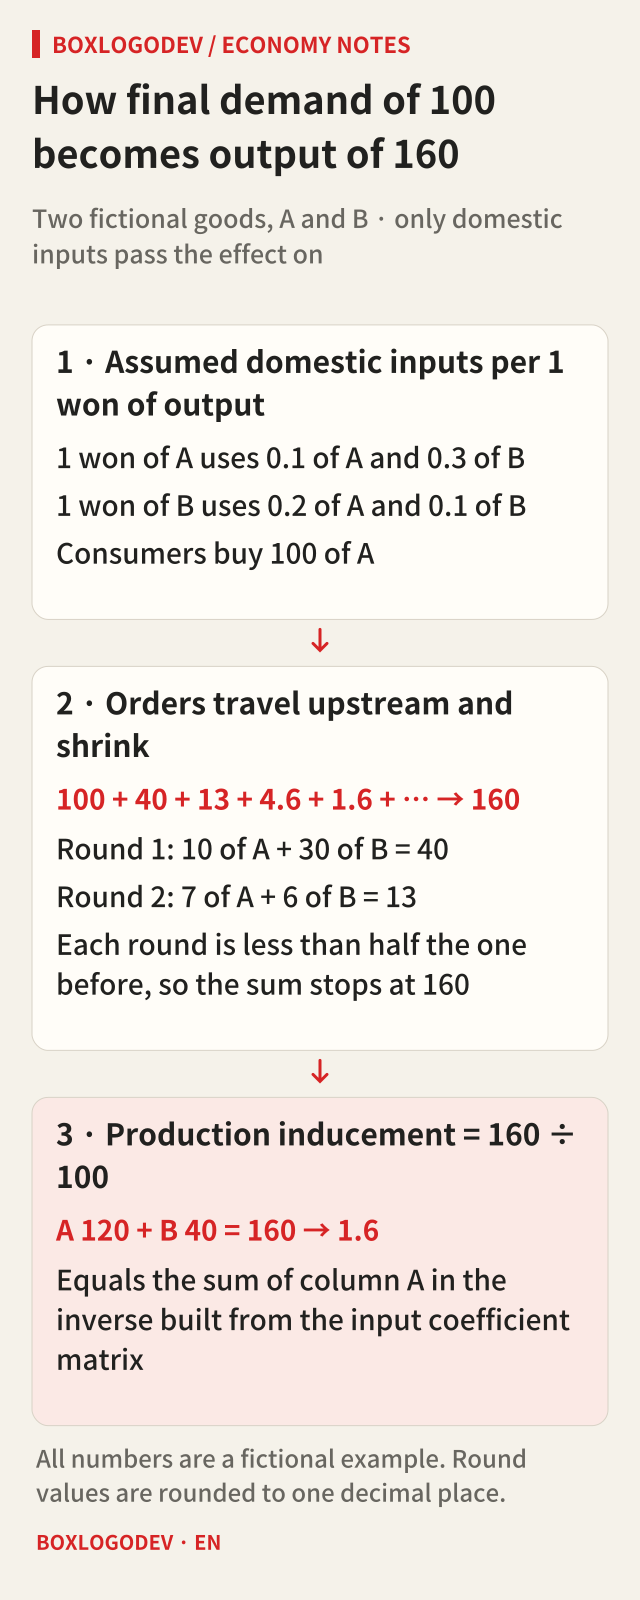
Take a fictional example. Making 1 won of good A uses 0.1 won of domestic A and 0.3 won of domestic B, and making 1 won of B uses 0.2 won of A and 0.1 won of B. When consumers buy 100 of A, the A factory orders 10 of A and 30 of B to make that 100 (first round, 40). Making those 40 requires another 7 of A and 6 of B (second round, 13). The third round adds 4.6 and the fourth 1.6, each round less than half of the one before. Summed without end, the total stops at 160: 120 of A and 40 of B.
Final demand of 100 induced output of 160, so A's production inducement coefficient is 1.6. In practice the rounds are not added one by one. Calling the matrix of domestic input coefficients Ad, the inverse of (I − Ad) is computed at once. The sum of each column of that inverse is the production inducement coefficient of that product. In the fictional example, A's column of the inverse is 1.2 and 0.4, which add up to 1.6.
60 of the 160 is counted twice
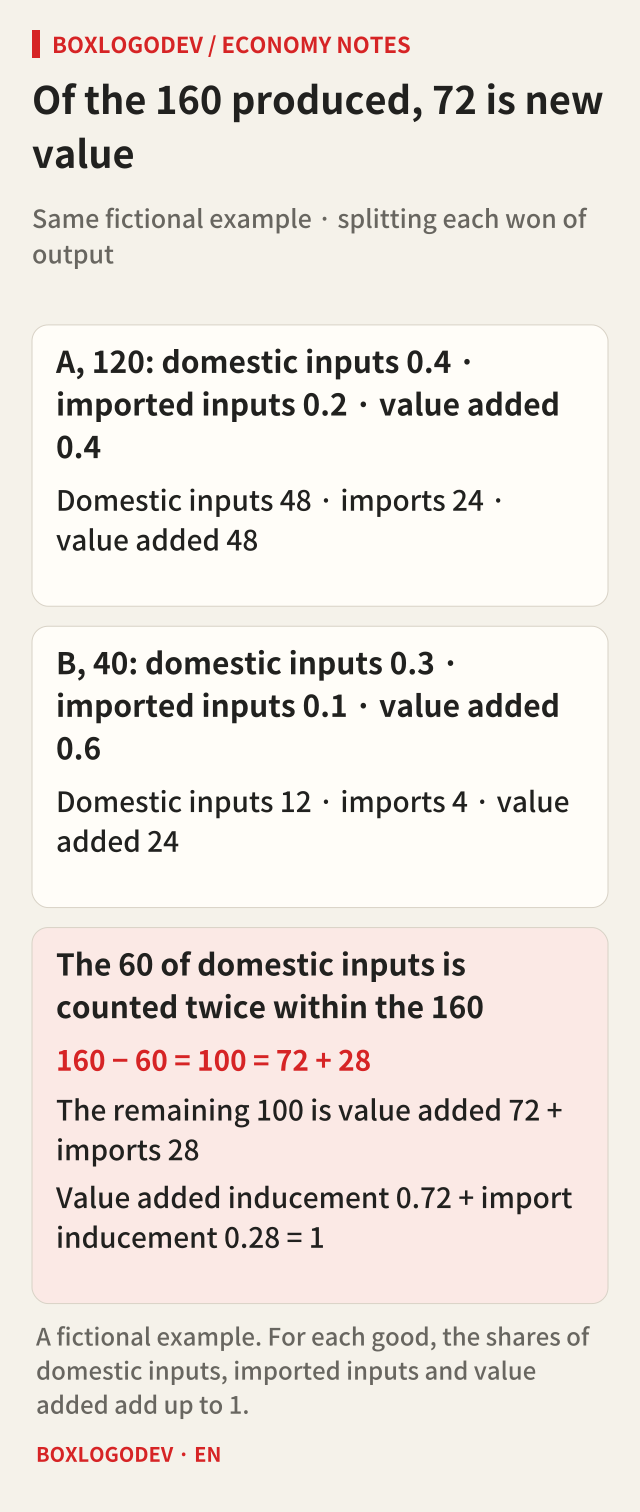
Output is a gross amount that includes the value of intermediate inputs. The 120 of A contains the value of the domestic B used to make it, and that B has already been counted once in B's output of 40. In the fictional example, the domestic inputs that A and B bought come to 48 on A's side and 12 on B's side, 60 in total. Take those 60 away from the output of 160 and exactly the final demand of 100 remains.
Now split each won of output into domestic inputs, imported inputs and value added. If A's shares are 0.4, 0.2 and 0.4 and B's are 0.3, 0.1 and 0.6, then A's 120 yields 48 of value added and 24 of imports, and B's 40 yields 24 of value added and 4 of imports. Value added totals 72 and imports 28, which together equal the final demand of 100. That is why the value added inducement coefficient of 0.72 and the import inducement coefficient of 0.28 add up to 1.
This is no coincidence. Domestic inputs are the output of other industries, so they are split again as the effect spreads; what is left unsplit is only value newly created in the country and goods bought from abroad. Each won of final demand therefore ends up entirely as value added or imports. The Bank of Korea's glossary of 800 economic and financial terms also notes that each industry's value added and import inducement coefficients always sum to 1. GDP is the sum of value added, so if the question is how much final demand adds to GDP, the number to look at is the value added coefficient, not the production coefficient.
Recomputing 1.808 from the 2024 table
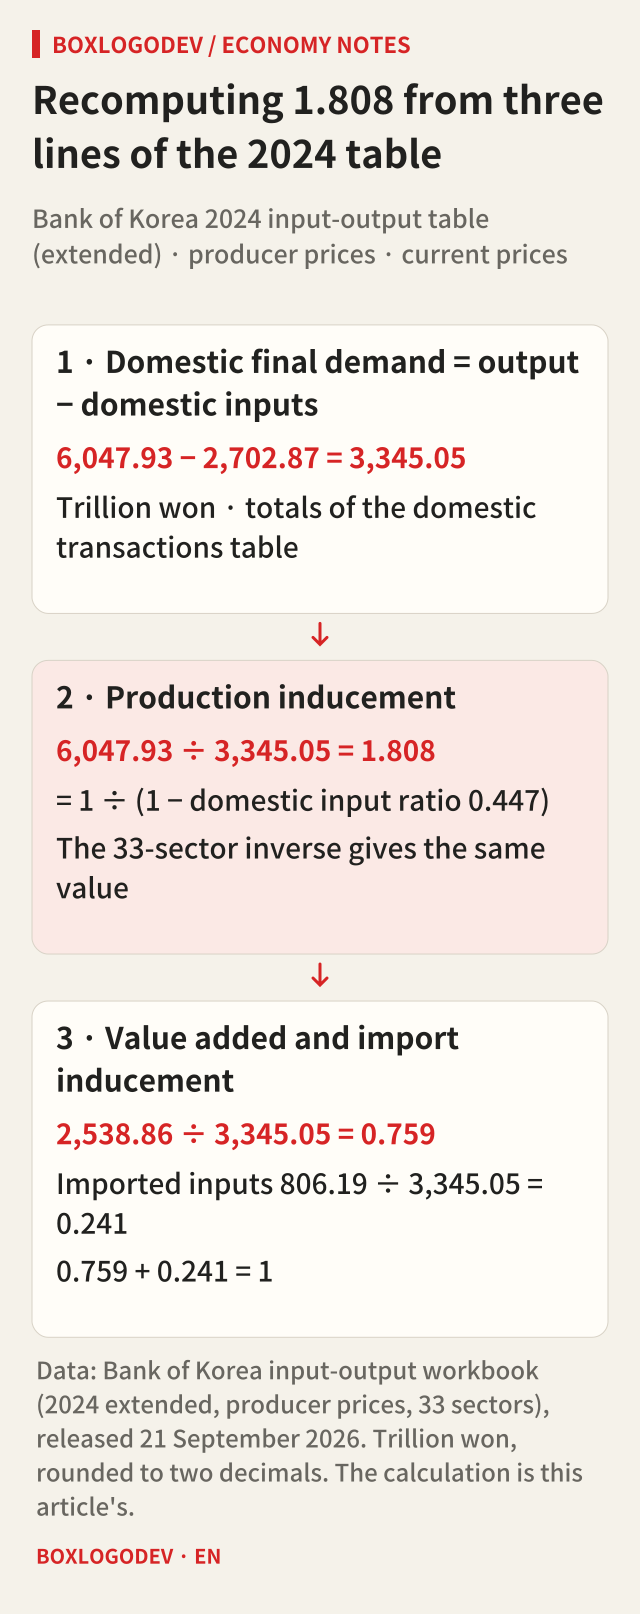
With the release, the Bank of Korea published a 33-sector input-output table as an Excel file. If all industries are merged into one sector, the calculation takes a few divisions. Total output in 2024 was 6,047.93 trillion won, of which 2,702.87 trillion won was used again as domestic intermediate inputs. Subtracting leaves final demand for domestic goods of 3,345.05 trillion won. 6,047.93 ÷ 3,345.05 = 1.808, the published figure.
In the same way, value added of 2,538.86 trillion won divided by 3,345.05 trillion won gives 0.759, and imported inputs of 806.19 trillion won give 0.241. The two add up to 1, and 2,538.86 + 806.19 is also 3,345.05. Computing the inverse directly from the 33-sector domestic input coefficient table reproduced the published production inducement table with differences below 10 to the power of −15, and gave the published 1.861 of output and 0.626 of value added per won of exports.
The calculation also shows that the production inducement coefficient is 1 ÷ (1 − the domestic input ratio). The domestic input ratio, the share of domestic intermediate inputs in total input, was 44.7% in 2024, and 1 ÷ (1 − 0.447) is 1.808. In 2023 the ratio was 45.3%, and 1 ÷ (1 − 0.453) is about 1.83, within rounding of the published 1.827. This is why the release names the lower domestic input ratio as the reason the coefficient fell.
Sectors that induce output and sectors that leave value
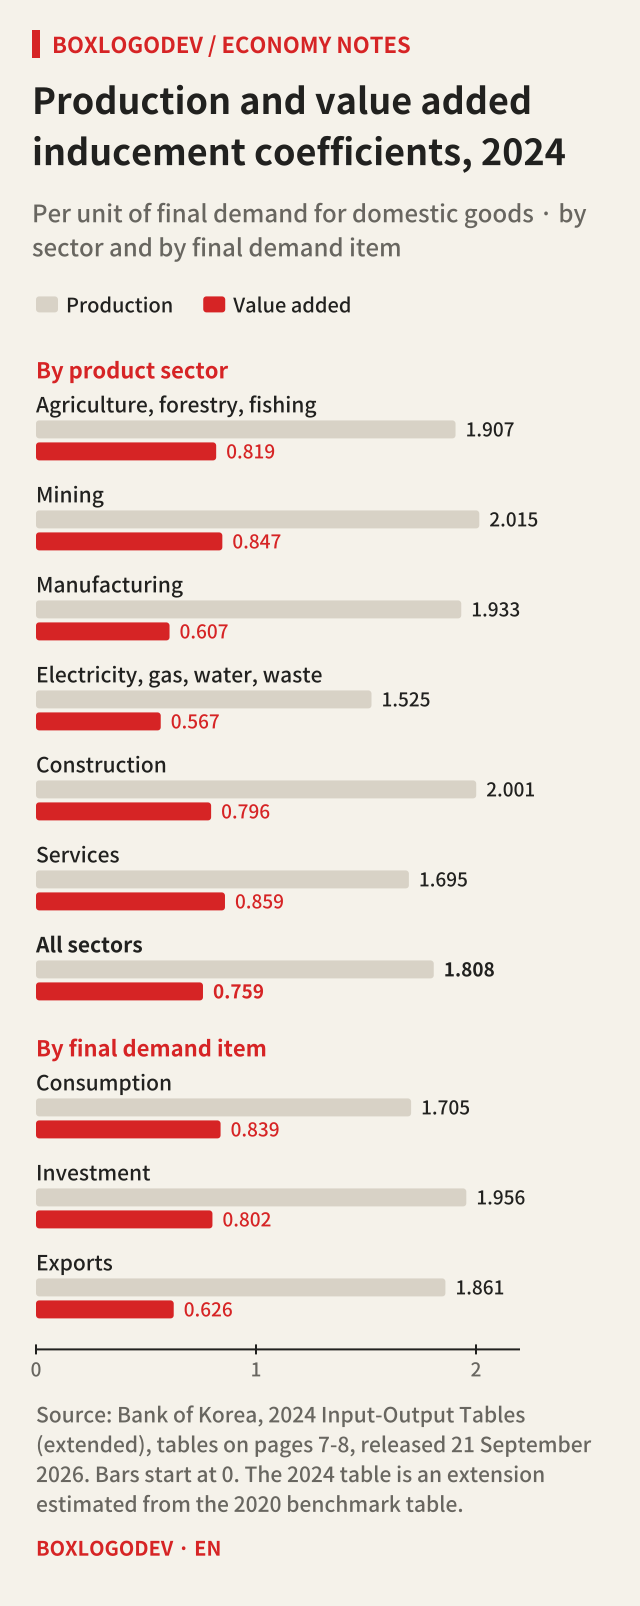
By sector, the two coefficients rank differently. Manufacturing's production coefficient of 1.933 is higher than services' 1.695, but its value added coefficient of 0.607 is lower than services' 0.859. Manufactured goods pass through many stages of parts and materials, so output grows, but much of those materials and parts is imported, and the import inducement coefficient is a high 0.394. In the 33-sector table, coal and petroleum products have a production coefficient of 1.312 and an import coefficient of 0.714. About 61% of this sector's total input is imported mining products, the category that includes crude oil, so more than 70% of each won of final demand leaks out as imports.
Final demand items behave the same way. In 2024 each won of exports induced 1.861 won of output, more than consumption's 1.705, but only 0.626 won of value added, less than consumption's 0.839. For the same reason, exports account for 35.1% of the output induced by final demand but only 28.2% of the value added.
What to keep in mind when using these coefficients
Induced output is a gross amount in which intermediate inputs are added again and again across industries. To compare with the size of the economy or with income, use induced value added; setting several industries' induced output beside GDP overstates the effect. The coefficients assume that input structures stay fixed and that there are no capacity limits, the 2024 table is an extension estimated from the 2020 benchmark table, and it is in current prices. They are better suited to comparing how strongly industries are linked than to predicting the actual effect of a particular project or policy.
When a report cites a production inducement effect of so many trillion won, look first for the value added inducement effect beside it. The gap between the two is the intermediate inputs counted twice. The release and tables are at Bank of Korea, 2024 Input-Output Tables (extended) (in Korean), and the detailed sector tables are under input-output tables in the Bank of Korea Economic Statistics System (ECOS).
Add your perspective.
Share a question, another approach, or something you have tried.
Checking sign-in…
Loading comments…