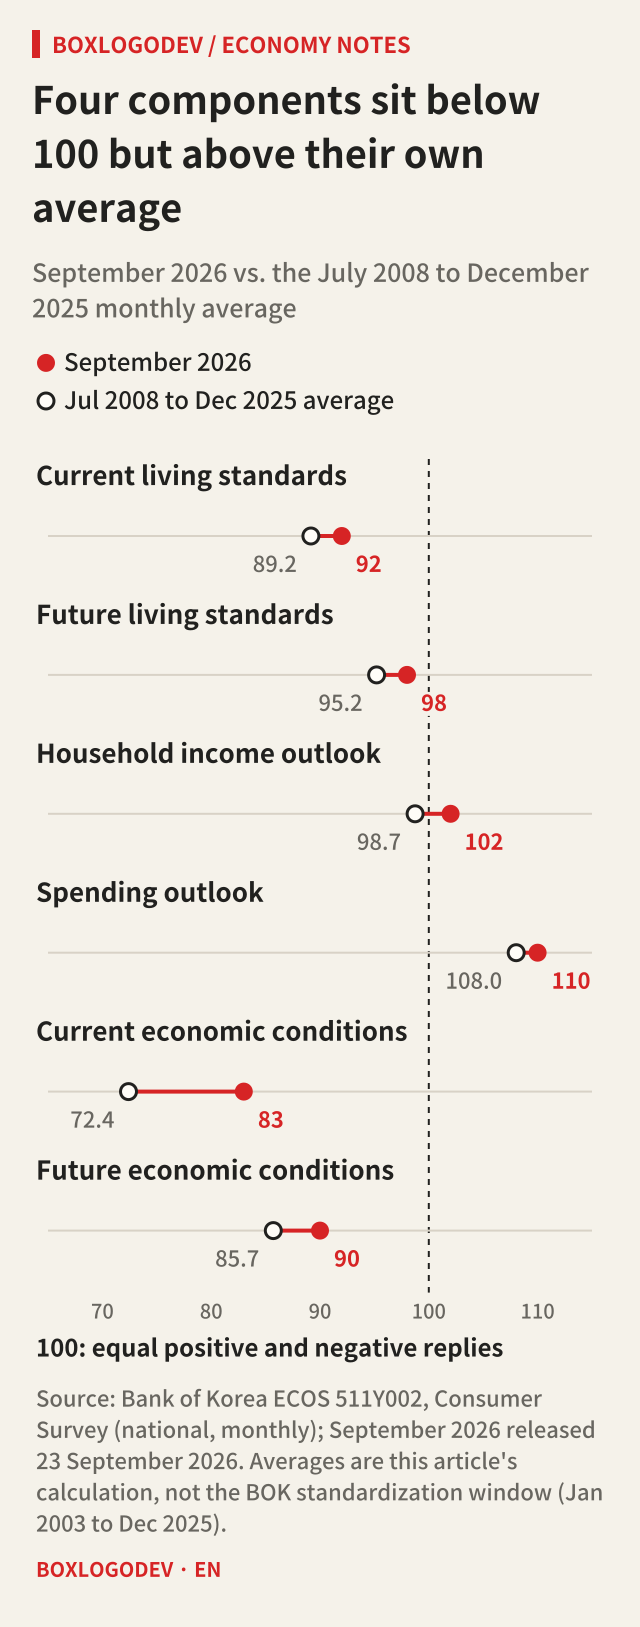
In the Bank of Korea's September consumer survey, released on 23 September 2026, the Composite Consumer Sentiment Index (CCSI) was 106.6, up 2.1 points from 104.5 in August. Yet the same release shows that four of the six components that make up the index were below 100: current living standards 92, future living standards 98, current economic conditions 83, and future economic conditions 90. Only the household income outlook, at 102, and the spending outlook, at 110, were above 100.
A plain average of those six numbers would not even reach 100, yet the composite is 106.6. The reason is that 100 means something different in each index. After reading this you will be able to tell the two 100s apart and roughly recalculate the CCSI yourself from the monthly values published in the Bank of Korea's ECOS statistics system.
In a single CSI, 100 is where "better" and "worse" balance
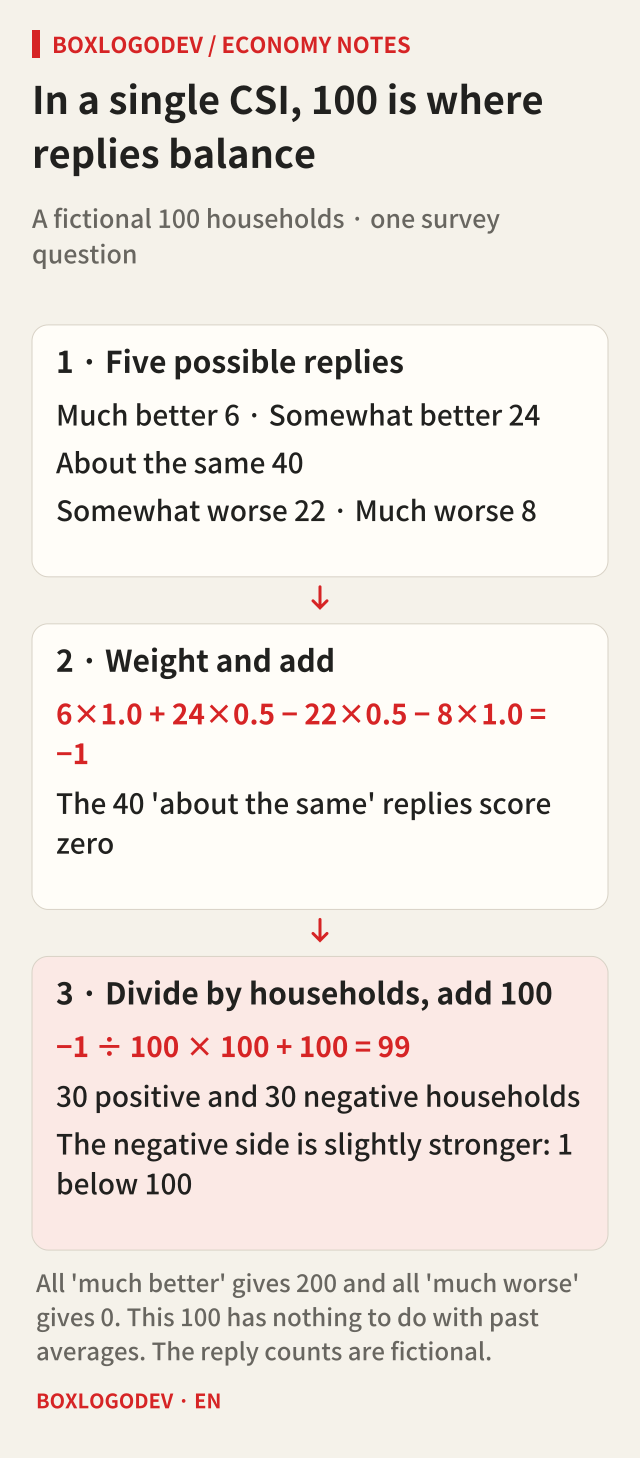
A consumer survey index (CSI) condenses the answers to one survey question into a single number. There are five possible replies. "Much better" scores 1.0, "somewhat better" 0.5, "about the same" 0, "somewhat worse" −0.5 and "much worse" −1.0. The scores are added, divided by the number of responding households, multiplied by 100, and 100 is added. The Bank of Korea's glossary of 800 economic and financial terms gives the same formula and notes that the index runs from 0 to 200.
Take a fictional 100 households. Suppose 6 say things will get much better, 24 somewhat better, 40 about the same, 22 somewhat worse and 8 much worse. The weighted sum is 6×1.0 + 24×0.5 − 22×0.5 − 8×1.0 = −1, and the CSI is −1 ÷ 100 × 100 + 100 = 99. Positive and negative replies both number 30 households, but the negative side has more "much" answers, so the index lands 1 below 100. The 40 households that said "about the same" score zero and do not move the result.
So in a single CSI, 100 is the balance point where positive and negative replies weigh the same. If every household says "much better" the index is 200, and if every household says "much worse" it is 0. This 100 has nothing to do with past averages.
The six components do not normally sit near 100
People answer each question with different habits. Averaging the 210 monthly values from July 2008 to December 2025 that ECOS publishes, the current living standards CSI averages 89.2. In those 210 months it never once reached 100; its highest month was 99. The current economic conditions CSI averages 72.4 and was below 100 in 199 of the 210 months. The spending outlook CSI, by contrast, averages 108.0 and usually sits above 100.
Against those averages, all six components were above their own averages in September 2026. Current living standards at 92 is above its 89.2 average, and current economic conditions at 83 is above its 72.4. "Below 100" means the "worse" replies outweigh the "better" ones. "Above average" means people are less pessimistic than in a typical month. Both statements can be true at once.
In the CCSI, 100 is the long-run average since 2003
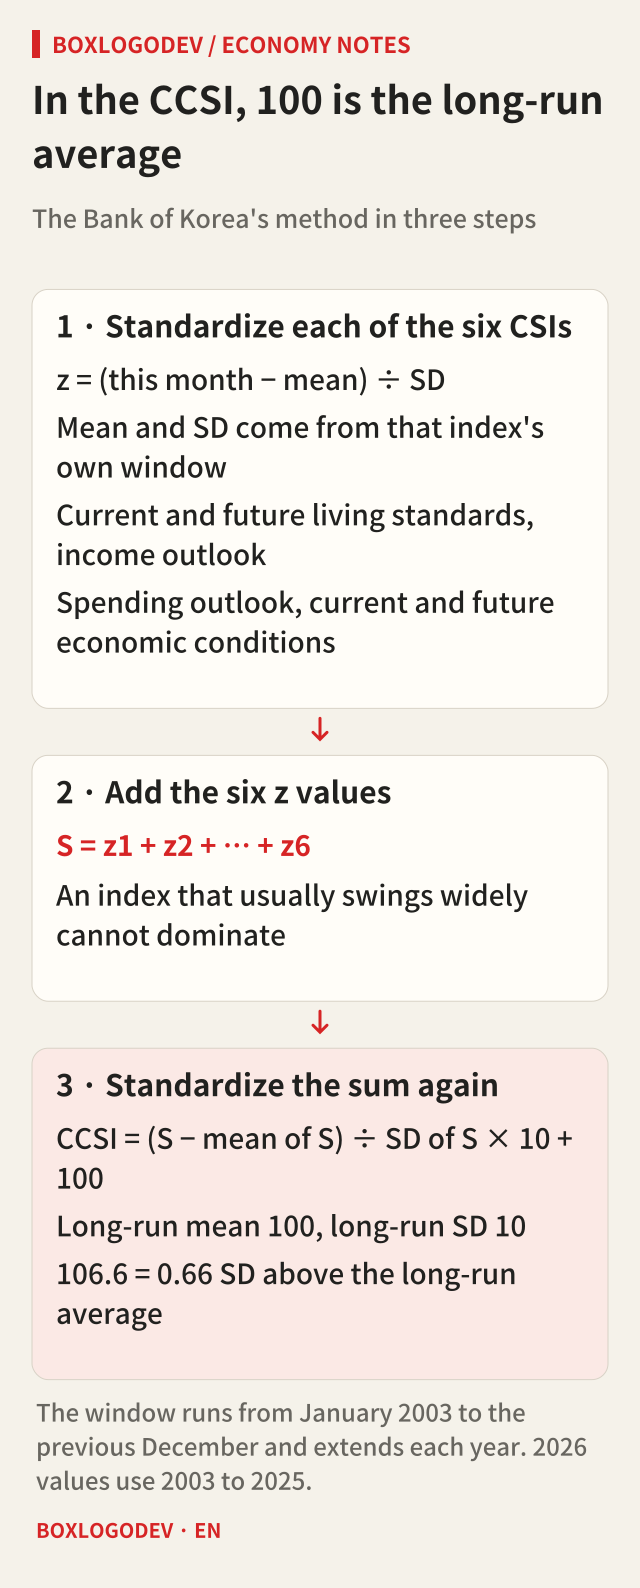
The CCSI does not simply average the six CSIs. The appendix to the release describes three steps. First, each CSI has the mean of its standardization window subtracted and is divided by its standard deviation. Next, the six standardized values are added. Finally, that sum is standardized again and rescaled so that its long-run mean is 100 and its long-run standard deviation is 10. The window runs from January 2003 to the previous December and is extended by a year at the start of each year. Values for 2026 are measured against 2003 to 2025.
So 106.6 does not mean positive replies outnumber negative ones by 6.6. It means the combined position of the six indexes is 0.66 of a standard deviation above the 2003–2025 long-run average. The release itself says a reading above 100 means consumers are more optimistic than the long-run average. Because the index measures distance from each component's own average, current living standards can push the CCSI up at 92 even though it almost never reaches 100. The release says the standardization adjusts for the excessive influence of any single component. In practice, a component that usually swings widely, such as current economic conditions, cannot drive the composite on its own.
Recalculating September from ECOS
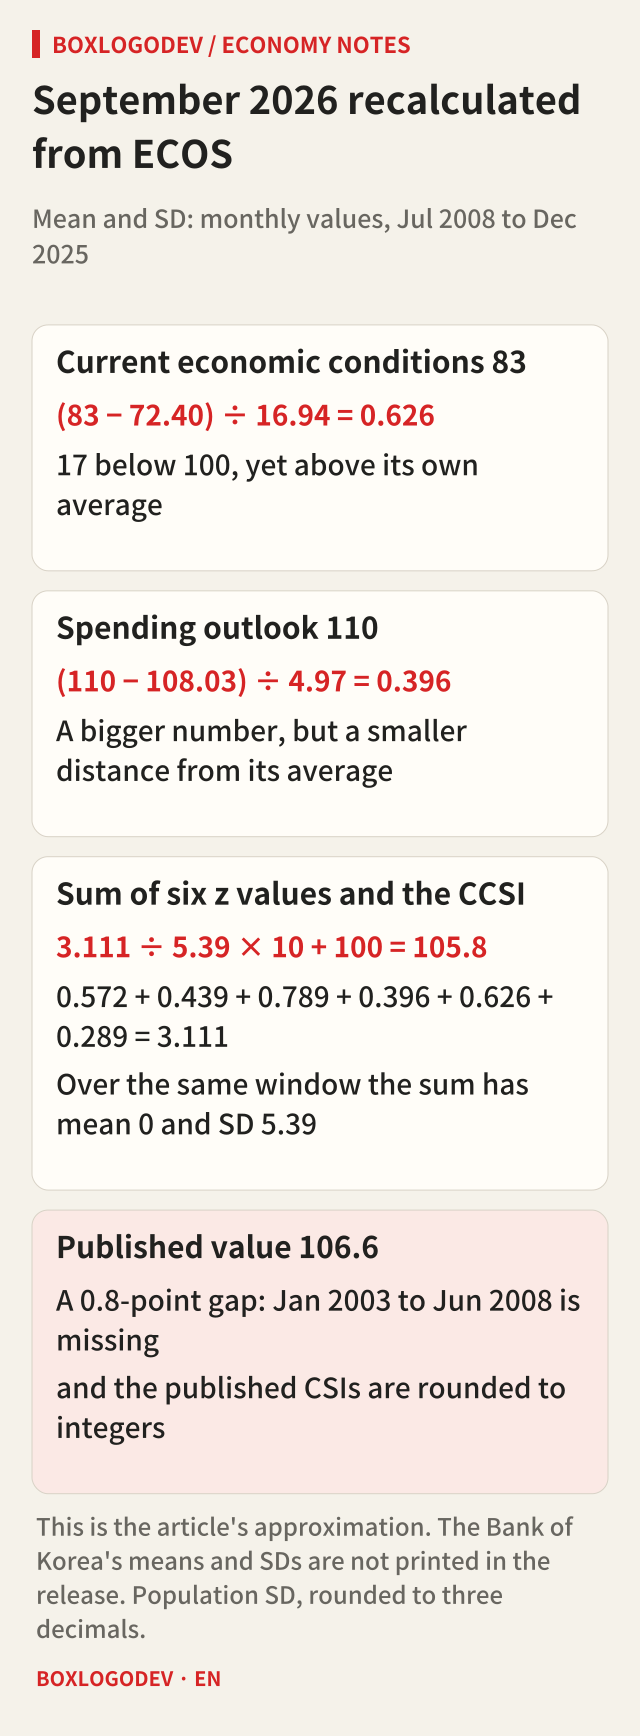
The steps can be followed with public data. The means and standard deviations the Bank of Korea uses are not printed in the release, so this calculation substitutes the July 2008 to December 2025 values from ECOS table 6.2.1 (Consumer Survey, national, monthly). It uses the population standard deviation, and the standardized values are rounded to three decimal places.
Current economic conditions gives (83 − 72.40) ÷ 16.94 = 0.626. The spending outlook gives (110 − 108.03) ÷ 4.97 = 0.396. The number 110 is much larger than 83, but current economic conditions is further from its own average. The other four come to 0.572 for current living standards, 0.439 for future living standards, 0.789 for the household income outlook, and 0.289 for future economic conditions. The six add up to 3.111.
Over the same 210 months this sum has a mean of 0 and a standard deviation of 5.39. So 3.111 ÷ 5.39 × 10 + 100 = 105.8, which is 0.8 points below the published 106.6. The calculation leaves out January 2003 to June 2008 from the Bank of Korea's window, and the published CSIs are rounded to whole numbers, so the result cannot match exactly. Done the same way, August comes out at 103.6, 0.9 points below the published 104.5, but the rise from August to September is 2.1 points, the same as the published change.
The release's table of component contributions tells the same story. Of September's 2.1-point rise, the household income outlook contributed the most, 0.9 points, while current living standards, unchanged at 92, contributed 0.0 points.
The first question to ask: which 100?
When you see a CSI or the CCSI, first check what its 100 means. Compared with 100, a single CSI tells you which way the replies lean. Compared with its own past average or the previous month, it tells you whether sentiment is better than usual. The CCSI has already been rescaled so that its long-run average is 100, so it can be compared with 100 directly. The interest rate outlook at 128 and the house price outlook at 125 are single CSIs too, so their 100 is the balance point, and because they are not among the six components they do not enter the 106.6.
The September survey covered 2,500 urban households nationwide from 9 to 16 September 2026, and 2,226 of them responded. It measures sentiment through a questionnaire, not actual spending or an official judgment of the business cycle. This article does not recommend any investment or spending decision. On the Bank of Korea's release calendar, October's results are due on 27 October 2026. The original is the Bank of Korea's September 2026 Consumer Survey release (in Korean), and the monthly values are in the Consumer Survey table 6.2.1 on ECOS, the Bank of Korea Economic Statistics System.
Add your perspective.
Share a question, another approach, or something you have tried.
Checking sign-in…
Loading comments…