The Bank of Korea’s Producer Price Index during September 2026 (preliminary), released on 21 October 2026, reports three headline results. The Producer Price Index (PPI) rose 0.2% from the previous month, the Domestic Supply Price Index was unchanged (0.0%), and the Total Output Price Index fell 0.1%. Same month, same release, three directions. The short answer is that the export part of the total output index fell 0.9%. Exports carry 23.2% of the weights, and about 27% of the index once their larger price rise since December is counted, so their fall outweighed the 0.2% rise in domestic shipments. After reading this you will be able to tell what each index adds to the others, and to recompute the total output index’s −0.1% yourself from the published indices. All September figures below are preliminary.
What the three indices count
The three indices share one core: goods and services that Korean producers sell in the Korean market, which the Korean-language edition of the release calls domestic shipments. The PPI counts only this core. In 2026 it surveys 890 items, at the basic price, the amount a producer actually receives per unit sold. The definition in the Bank of Korea’s Korean-language glossary of 800 economic and financial terms (2026 edition) points to the same scope. The English edition prints no separate figures for the domestic, import and export parts of the other two indices; the weights and September changes of those parts below come from the Korean edition.
The Domestic Supply Price Index adds imported goods; imported services are not included. Because it is compiled by stage (raw materials, intermediate goods and services, final goods and services), it is used to follow how raw-material prices pass through to the intermediate and final stages. Adding up the 2026 stage weights gives 777.504 for domestic shipments and 222.496 for imports, per 1,000.
The Total Output Price Index adds exported goods instead, to track the prices of domestic output as a whole. Its weights are 767.983 for domestic shipments and 232.017 for exports. The export side also covers goods only: export weights appear only under manufacturing products (231.228) and agricultural, forestry and marine products (0.789), and service exports are not included. Neither the supply index nor the output index has a price survey of its own: each combines the PPI with the import or the export price index.
Downloading 45 months, January 2023 to September 2026, from the Bank of Korea’s Economic Statistics System (ECOS) shows that the domestic-shipment part of the total output index has the same value as the PPI in every month. So every difference between the PPI and the total output index comes from the export part.
ECONOMY NOTES
What each index covers
2026 weights (per 1,000) and September month-on-month change; September is preliminary
Producer Price Index · +0.2%
- Goods and services made and sold in Korea (domestic shipments)
- 890 items in 2026, at the basic price producers receive
- Agricultural, forestry and marine products +2.6%; power, gas, water and waste +1.3%
Domestic Supply Price Index · 0.0%
- Domestic shipments + imported goods (no imported services)
- Stage weights added up: domestic 777.504, imports 222.496
- Raw materials +3.2%, intermediate −0.3%, final −0.3%
Total Output Price Index · −0.1%
- Domestic shipments + exported goods (no service exports)
- Weights: domestic 767.983, exports 232.017
- Domestic shipments +0.2%, exports −0.9%
- The domestic part has the same values as the PPI
The supply and output indices have no price survey of their own: they combine the PPI with the import or export price index. Import and export parts are contract prices shifted by the customs-clearance lag. Source: Bank of Korea release of 21 October 2026; ECOS table 405Y007 (retrieved 27 October 2026).
Where September split
In September, when the PPI rose 0.2%, agricultural, forestry and marine products rose 2.6% and electric power, gas, water and waste rose 1.3%; manufacturing products were unchanged and services fell 0.1%.
In the domestic supply index, imports moved most at every stage. Raw materials rose 3.2%, with imports up 3.7% and domestic shipments up 1.5%. The intermediate stage fell 0.3%, led by imports (−2.4%). The final stage fell 0.3%: domestic shipments rose 0.2% but imports fell 2.6%. Working out contributions from the six ECOS part indices, domestic shipments added about 0.1 percentage points and imports took away about 0.1 points, which left the total unchanged. These contributions are this note’s calculation, not a Bank of Korea figure.
In the total output index, domestic shipments rose 0.2% and exports fell 0.9%. Manufacturing products fell 0.4%, led by exports. Even with the 23.2% base weight alone, the −0.9% of exports outweighs the +0.2% of domestic shipments, but the fall this gives (−0.055%) is less than half the −0.128% change in the published index levels. The next section works out the gap.
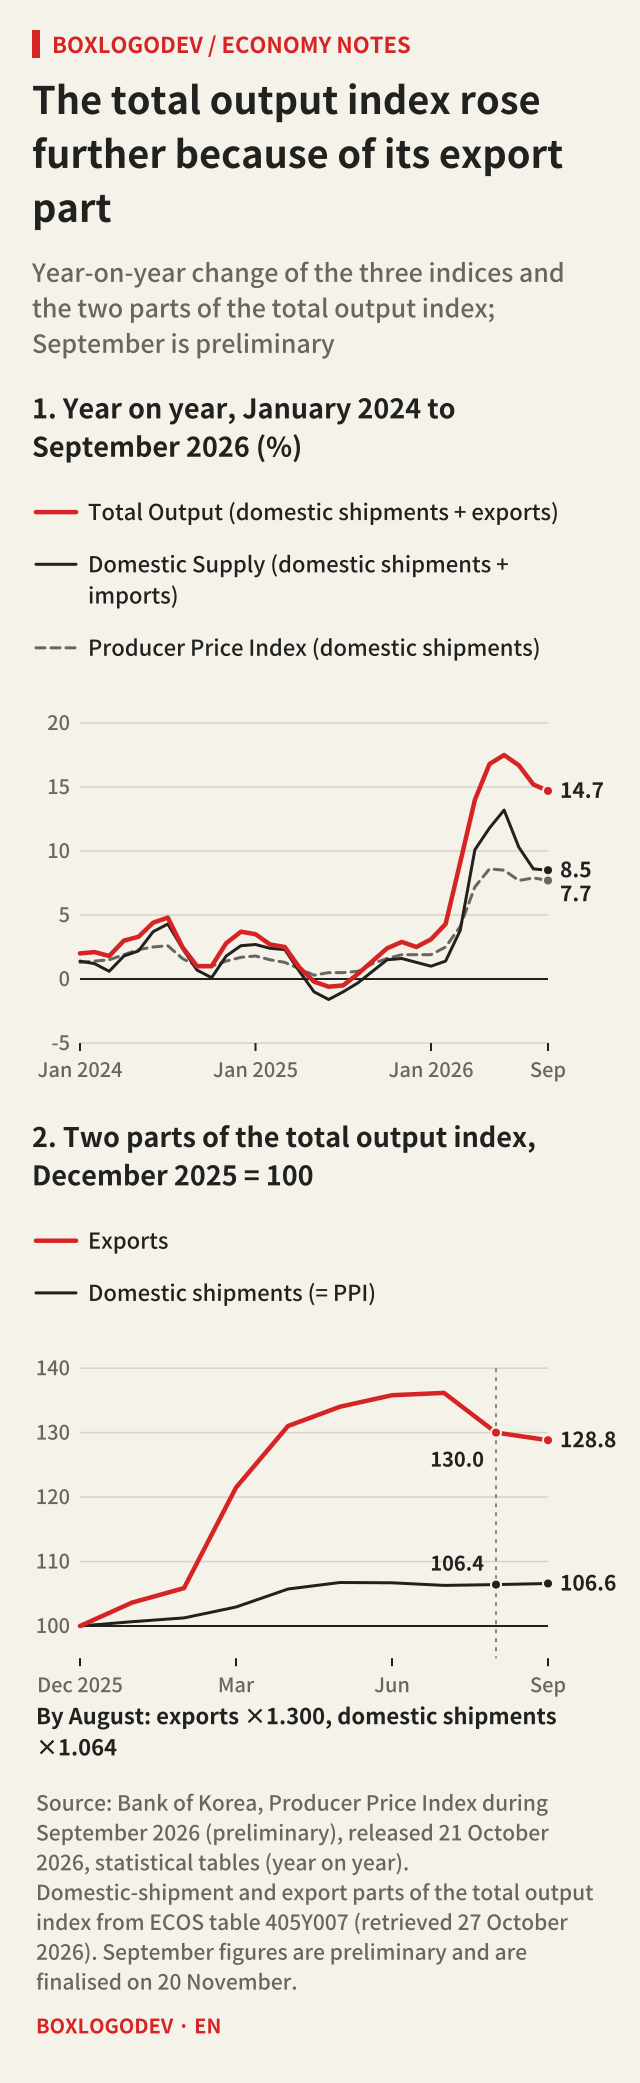
Year on year the gap is wider. In September the PPI was up 7.7%, the domestic supply index 8.5% and the total output index 14.7%, and the export part of the total output index stood 39.8% above a year earlier. Through 2024 and 2025 all three year-on-year rates stayed between −1.6% and 4.8%; from March 2026 all three climbed and spread apart. The total output index rose most, to 17.5% in June; the domestic supply index reached 13.2% in June and the PPI 8.6% in May.
Recomputing the −0.1% by hand
All you need are three ECOS series for the total output index (the total, domestic shipments and exports, retrieved on 27 October 2026) and the 2026 weights from the release.
Step 1, a plain average with the base weights. 0.768 × 0.2 + 0.232 × (−0.9) = −0.055%. The sign is right. But the published index went from 141.12 to 140.94, a change of −0.128%, so the plain average gives less than half the fall.
Step 2, unrounded changes. Measured from the index levels, domestic shipments went from 129.58 to 129.78, +0.154%, and exports from 184.34 to 182.67, −0.906%. With the same weights the average is −0.092%, still short.
Step 3, more weight for what rose more since December. The Bank of Korea’s Korean-language handbook on price statistics (2024) explains that the PPI is chain-weighted. For each item it takes the price relative against the previous December, averages those relatives with the weights applied in that year (based on transactions three years earlier), and links the result to the previous December’s index. The export and import price indices use the same formula. Under this method the 23.2% weight is attached to December prices, and a part that has risen more since December takes a larger share of the index. From December 2025 to August 2026 the export part went from 141.80 to 184.34, 1.300 times, and the domestic part from 121.76 to 129.58, 1.064 times. So the effective export share of the August index is 0.232 × 1.300 ÷ (0.768 × 1.064 + 0.232 × 1.300) = 27.0%. Averaging again with this share gives 0.7304 × 0.1543 + 0.2696 × (−0.9059) = +0.1127 − 0.2442 = −0.1315%, almost exactly the change in the published index.
Step 4, check the index level. 126.12 × (0.768 × 129.78 ÷ 121.76 + 0.232 × 182.67 ÷ 141.80) = 140.93. That is 0.01 index points from the published September figure of 140.94, and the same formula gives 141.12 for August, equal to the published value. Repeating it for every month from January to September 2026 keeps the gap within 0.02 index points. Using the 2025 annual average instead of December as the base widens the gap to as much as 0.38 index points.
There is a limit. The handbook describes the PPI formula; this note found no statement that the total output index combines domestic shipments and exports this way. What this note confirms is that calculating this way reproduces the published values. The remaining gap is small enough for rounding to explain. The five input levels and the published value are all printed to two decimals, so rounding alone can put the result off by up to about 0.02 points, and the January to September gaps (at most 0.014 points) all fall inside that.
ECONOMY NOTES
Recomputing the −0.1%
Total output price index, August to September 2026, in four steps from published indices
Plain average with the base weights
- 0.768 × 0.2 + 0.232 × (−0.9) = −0.055%
- Published levels: 141.12 → 140.94, −0.128%
- Right sign, less than half the fall
Use unrounded changes
- Domestic 129.58 → 129.78, +0.154%
- Exports 184.34 → 182.67, −0.906%
- 0.768 × 0.154 + 0.232 × (−0.906) = −0.092%
What rose more since December weighs more
- December 2025 → August 2026: exports ×1.300, domestic ×1.064
- Effective export share = 0.232 × 1.300 ÷ (0.768 × 1.064 + 0.232 × 1.300) = 27.0%
- Contributions: domestic +0.113 pp, exports −0.244 pp, total −0.131%
Check the index level
- 126.12 × (0.768 × 129.78 ÷ 121.76 + 0.232 × 182.67 ÷ 141.80) = 140.93
- 0.01 index points from the published 140.94; August matches at 141.12
- January to September 2026: all within 0.02 points
Computed from ECOS table 405Y007 (retrieved 27 October 2026) and the 2026 weights. The chain formula with the previous December as price base is how the Bank of Korea's 2024 price statistics handbook describes the PPI; applying it to the total output index is this note's reconstruction.
Cautions when reading
- The September figures are preliminary. They are finalised, and may change, on Friday 20 November, when the October PPI is released (Bank of Korea statistics release calendar, checked on 30 October 2026). As in the September release, the October domestic supply and total output indices are likely to appear in that PPI release. Until then, September is the latest month.
- The October export and import price indices have an earlier release date: Friday 13 November, a week before the PPI. But those indices use contract-date prices (the gap between contract and customs times is covered in the note on the terms of trade), while the domestic supply and total output indices use prices shifted by the customs-clearance lag. The export price change published on 13 November cannot be dropped into the export part of the total output index as it is.
- An index measures price change, not the price level. The total output index at 140.94 sitting above the PPI at 129.78 means it has risen more since 2020 (= 100), not that exported goods are more expensive.
- The release notes that the PPI can be compared with the Consumer Price Index but cannot be used to measure margins between the producer and retail stages. The final stage of the domestic supply index also includes capital goods, so it can move differently from consumer prices.
- Weights change every year. The export weight in the total output index is 232.017 in 2026, while the handbook gives 213.1 for 2024. Applying the same 23.2% to 2024 months misses the published values by up to 0.22 index points; the 2024 weight is needed to reproduce them within 0.01 points.
What to look at in the next release
When the PPI and the total output index move in different directions, the difference comes from the export part. Before multiplying the export change by the 23.2% base weight, work out the effective share. Multiply the base weight by how many times that part’s price has grown from the previous December to the previous month, then divide by the sum of the same products for domestic shipments and exports. In a year like 2026, when the export part rose 30% from December to August, the effective share grows to 27.0%, so the same −0.9% pulls the total down further. For the domestic supply index the domestic and import weights are published only by stage (raw materials, intermediate, final), so the same calculation runs over six parts.
Add your perspective.
Share a question, another approach, or something you have tried.
Checking sign-in…
Loading comments…