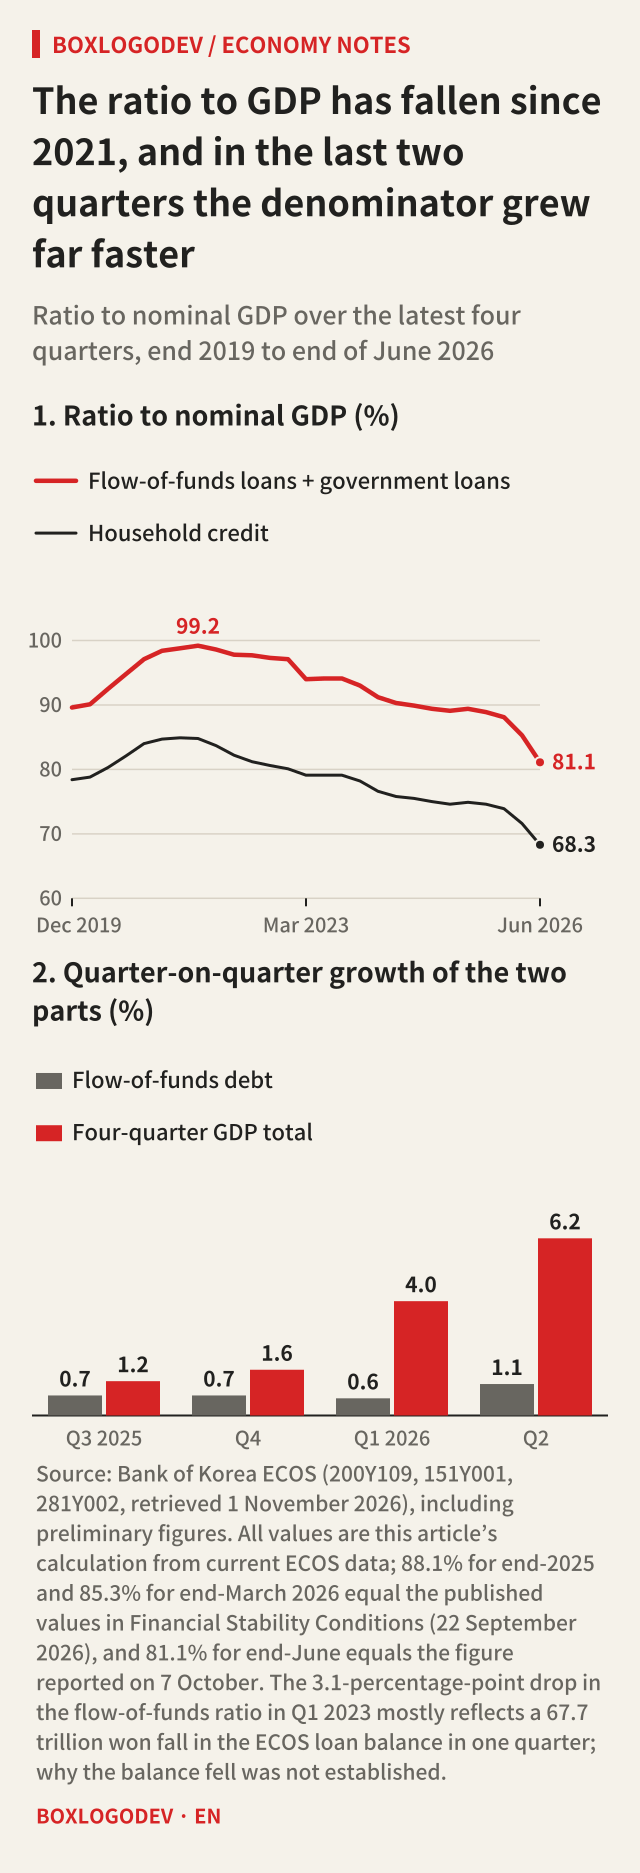
In figures the Bank of Korea released on 19 August 2026, household credit stood at 2,019.8 trillion won at the end of June, 25.9 trillion won more than at the end of March. Yet the household debt-to-GDP ratio went from 88.1% at the end of 2025 and 85.3% at the end of March 2026 to 81.1% at the end of June. The Bank's Financial Stability Conditions paper, reviewed by its Monetary Policy Board on 22 September, had expected about 81%, and 81.1% was reported on 7 October, the day the Q2 flow of funds statistics came out. Debt went up and the ratio went down. And dividing 2,019.8 trillion won by GDP does not give 81.1% at all.
After reading this you will be able to recompute the ratio from public statistics and split its fall between debt and GDP. You will also know what a falling ratio does and does not tell you.
The debt in the 81.1% is not household credit
The numerator comes first. Household credit is loans from financial institutions to ordinary households plus sales credit, meaning purchases on credit through cards, instalment plans and the like. The household side of the flow of funds is wider: it includes small sole proprietors and non-profit bodies serving households, and it also covers foreign-currency loans and government loans, among other items. The paper also calls this ratio “household credit leverage”, but the note to its chart says it is on a flow of funds basis. The name alone is easy to misread.
The same note gives the denominator: nominal GDP for the quarter and the three before it. For the end of June that is 676.2 + 711.4 + 739.3 + 831.8 trillion won, and the unrounded sum is 2,958.6 trillion won. Adding the four printed values gives 0.1 more because of rounding.
The items in the numerator are not in the September paper, but a note in the Bank's June Financial Stability Report gives them: for households, its private credit measure uses loans and government loans from the flow of funds. Adding those two items for households and non-profits, using flow of funds balances from the Bank's ECOS database, gives 2,359.2 ÷ 2,676.7 = 88.14% for the end of 2025 and 2,374.1 ÷ 2,784.7 = 85.26% for the end of March 2026, the same as the published 88.1% and 85.3% to one decimal place. For the end of June, 2,333.2 + 67.2 = 2,400.4, and 2,400.4 ÷ 2,958.6 = 81.13%, which fits the reported 81.1% and the September paper's “about 81%”. The second decimals are this article's calculation. Some of the figures are preliminary and may change.
Household credit over the same denominator is 2,019.8 ÷ 2,958.6 = 68.27%. That is not a wrong figure; it is a different ratio. This is why dividing the 2,000 trillion won in a news story by GDP will not produce the 81.1% in the same story.
ECONOMY NOTES
81.1% does not come from 2,019.8 trillion won
End of June 2026 · trillion won · denominator: nominal GDP over the latest four quarters
Denominator
676.2 + 711.4 + 739.3 + 831.8- Nominal GDP, Q3 2025 to Q2 2026
- Unrounded sum 2,958.6 (the printed values add to 0.1 more)
With household credit on top
2,019.8 ÷ 2,958.6 × 100 = 68.27- Household loans plus sales credit
- This article's calculation, using the same denominator
With flow-of-funds loans plus government loans
2,400.4 ÷ 2,958.6 × 100 = 81.13- 2,333.2 + 67.2 = 2,400.4
- Includes small sole proprietors and non-profits
- Matches the reported 81.1% and the September “about 81%”
The same items on published values
- End of March 2026: 2,374.1 ÷ 2,784.7 = 85.26; published 85.3
- End of 2025: 2,359.2 ÷ 2,676.7 = 88.14; published 88.1
Source: Bank of Korea ECOS (200Y109, 151Y001, 281Y002, retrieved 1 November 2026) and its Financial Stability Conditions paper (22 September 2026). The 81.1% is the figure reported on 7 October 2026, the day of the flow of funds release. The numerator items follow note 24 of the June 2026 Financial Stability Report.
Debt rose 1.1%, the denominator 6.2%
Now the question in the title. From the end of March to the end of June the numerator went from 2,374.1 to 2,400.4 trillion won, up 26.3 trillion won (1.1%). The denominator went from 2,784.7 to 2,958.6 trillion won, up 173.9 trillion won (6.2%). Because it is a four-quarter total, the 657.9 trillion won of Q2 2025 dropped out and the 831.8 trillion won of Q2 2026 came in. The quarter coming in is 26.4% larger than the one going out.
Taking the steps in order makes this clearer. Hold the denominator at its March level and the ratio is 2,400.4 ÷ 2,784.7 = 86.20%: the extra debt lifts it 0.94 percentage point from 85.26%. Then move the denominator to June and it falls 5.07 percentage points to 81.13%. The total is −4.13 percentage points. With the denominator unchanged, reaching the same 81.13% would have taken debt down to 2,259.2 trillion won, a cut of 114.9 trillion won. In fact it rose 26.3 trillion won.
The Bank's account points the same way. The September paper credits strong GDP growth for the fall through the end of March, and for its end-June expectation it adds tighter household lending rules, among other factors, to continued GDP growth. It also writes that the fall in private credit leverage comes mainly from growth driven by things such as a surge in semiconductor exports, so deleveraging efforts should continue in case conditions change, including a possible cut in AI-related investment. On 7 October the Bank's flow of funds team lead was reported as saying nominal GDP rose 6.2% while household debt rose 1.1%. One way to read this is that a fall led by the denominator can reverse if the denominator turns.
Here is a check with made-up numbers, an assumption to show the arithmetic and not a forecast. If the four-quarter GDP total were 5% smaller, at 2,810.7 trillion won, then with debt unchanged the ratio would be 2,400.4 ÷ 2,810.7 = 85.40%. In that case the ratio returns to its March level without a single won of new debt.
ECONOMY NOTES
From 85.26% to 81.13%: numerator and denominator
End of March to end of June 2026 · trillion won · this article's calculation
Numerator: debt rose
- 2,374.1 → 2,400.4 (+26.3, +1.1%)
Denominator: it rose far more
- 2,784.7 → 2,958.6 (+173.9, +6.2%)
- Q2 2025 at 657.9 drops out, Q2 2026 at 831.8 comes in
Hold the denominator at March
2,400.4 ÷ 2,784.7 × 100 = 86.20- Debt alone lifts the ratio by 0.94 percentage point
Move the denominator to June
86.20 − 5.07 = 81.13- +0.94 − 5.07 = −4.13 percentage points
- With GDP unchanged, debt would need to fall 114.9
Made-up case: denominator 5% smaller
2,400.4 ÷ 2,810.7 × 100 = 85.40- With debt unchanged, the ratio is back above 85%
Source: Bank of Korea ECOS (200Y109, 281Y002, retrieved 1 November 2026). Figures are preliminary and may be revised. The 5% case is a made-up number to show the arithmetic, not a forecast.
Lower does not mean low
A ratio to income is another figure again. The paper estimates that household credit relative to income fell sharply from 134.1% to 127.8%. Here the numerator is household credit and the denominator disposable income. Its chart shows quarter-on-quarter growth of 6.4% in disposable income and 1.3% in household credit. Working back, 1,993.9 ÷ 1.341 = 1,486.9 and 2,019.8 ÷ 1.278 = 1,580.4, a rise of 6.3%; the 0.1 gap arises because this works back from rounded ratios. So the same date carries 68.3%, 81.1% and 127.8%, and those values should not be compared with one another.
Judging the level takes a benchmark. The 85.3% for the end of March is above the long-run average since 2010 of 84.0%, and above the 66.0% for the 16 advanced economies, Korea among them, in the same paper. The Bank's September monetary policy report says that at the end of 2025 this ratio was the sixth highest of the 44 economies the BIS covers. It also expects that if nominal GDP grows in a 15–20% range in 2026, the ratio will this year reach the lower end of the 80–85% zone it describes as a threshold for constraining growth. The 81.1% for the end of June is below the long-run average, but the gap with the advanced-economy figure for the end of March remains wide. A big fall and a low enough level are different things.
This ratio cannot show the repayment burden
A note in the Bank's June Financial Stability Report says that measures such as household debt relative to disposable income cover all households, with or without debt, and so may move differently from the DSR, which shows the repayment burden of indebted households or borrowers. The ratio to GDP also uses the whole balance, so this article reads it as having the same limit. The DSR divides a year's principal and interest repayments by a year's income, so it looks at money going out each year rather than a balance.
Here is a made-up example. With income of 60 million won a year, debt of 200 million won, principal repayments of 6 million won a year and a 4% rate, interest is 8 million won and the DSR is (600 + 800) ÷ 6,000 = 23.3%, in units of 10,000 won. At 5%, interest rises to 10 million won and the DSR is (600 + 1,000) ÷ 6,000 = 26.7%. Debt over income is 333% in both cases. So the repayment burden can change while the balance ratio stays put, and these numbers are not for judging any real loan.
ECONOMY NOTES
Three ratios for one date, and the repayment burden
Different numerators and denominators cannot be compared
68.3%: household credit ÷ nominal GDP
- End of June, this article's calculation
81.1%: flow-of-funds debt ÷ nominal GDP
- End of June, reported 7 October (September forecast: about 81%)
- Published 85.3% for end-March; long-run average 84.0%
127.8%: household credit ÷ disposable income
- End of June, Bank of Korea estimate (134.1% at end-March)
DSR: yearly repayments ÷ yearly income
(600 + 800) ÷ 6,000 = 23.3%- Made-up case (10,000 won): debt 20,000, income 6,000, principal 600, rate 4%
- At 5%: (600 + 1,000) ÷ 6,000 = 26.7%
- Debt ÷ income stays at 333%
Source: Bank of Korea, Financial Stability Conditions (22 September 2026), its 2026 glossary of economic terms, p. 322, for the DSR definition, and ECOS. The DSR example is made up and is not for judging any loan.
The actual data show the average and the vulnerable group moving apart. The household loan delinquency rate fell from 1.00% at the end of March 2026 to 0.98% at the end of June, but the share of vulnerable borrowers by number rose from 6.7% to 6.8%. The Bank raised its base rate in July and August, and the paper judges that households on average are better placed to cope than in past hiking cycles, while vulnerable borrowers' delinquency is higher than it was then and their ability to repay appears somewhat weaker. The June report puts the average DSR of multi-home households at 33.7% among households with financial debt as of March 2025, and its chart shows the low- and middle-income groups among those multi-home households above 40%, the level the report treats as its management benchmark. The denominator in that analysis is disposable income rather than yearly income, so it should not be read as the same thing as the 40% in lending rules.
How to read news about the ratio
First, check which statistic is the numerator. Second, see whether the denominator is GDP or disposable income, and how many quarters it adds up. Third, write down the growth of the numerator and the denominator separately. With 1.1% against 6.2%, as here, most of the fall is a story about the denominator.
The sources are the Bank of Korea's household credit release for Q2 2026 (in Korean), its Financial Stability Conditions paper of September 2026 (in Korean) and its June 2026 Financial Stability Report (in Korean). On the Bank's release calendar, Q3 household credit is due on 18 November 2026 and preliminary Q3 national income on 9 December. When Q3 household credit appears, note how far it rose and set that beside how far the four-quarter GDP total rises in December. Household credit is not the same statistic as the numerator of the 81.1%, though their Q2 growth rates were close, at 1.3% and 1.1%.
Add your perspective.
Share a question, another approach, or something you have tried.
Checking sign-in…
Loading comments…