Look up the end-of-July balances in the Bank of Korea’s Economic Statistics System (ECOS) and two numbers move in opposite directions. Base money fell from 315.2 trillion won at the end of June to 296.2 trillion at the end of July, down 19.0 trillion (6.0%). Broad money, M2, rose from 4,211.5 trillion to 4,240.0 trillion, up 28.5 trillion (0.7%). By the textbook formula “money supply = money multiplier × base money”, M2 should fall when base money falls. After reading this note you will be able to compute the money multiplier yourself and explain why it changes depending on whether you use month-end balances or monthly averages.
Base money and the money multiplier
Base money is the money the Bank of Korea supplies directly. It is the cash held by people and firms (currency in circulation) plus the reserves that banks and other deposit-taking institutions keep against withdrawals: the cash in their vaults and their deposits at the Bank of Korea. When a bank takes a deposit it keeps only part of it as reserves and lends the rest, and that loan comes back as another deposit. That is why the money in the economy is several times the base money.
The Bank of Korea’s glossary, 800 Economic and Financial Terms (2026 edition), calls that multiple the money multiplier and says it is found by dividing the money stock by base money. The same entry gives the multiplier in terms of a currency ratio and a reserve ratio.
k (money multiplier) = 1 ÷ {c + (1 − c) × r} (c is the share of currency in the money stock; r is reserves relative to the money stock excluding currency)
First, made-up numbers. If people hold 5% of their money as cash (c = 0.05) and banks keep 2% of deposits as reserves (r = 0.02), the denominator is 0.05 + 0.95 × 0.02 = 0.069 and the multiplier is 1 ÷ 0.069 = 14.49. With a 7% reserve ratio the denominator is 0.05 + 0.95 × 0.07 = 0.1165 and the multiplier shrinks to 8.58. If nobody holds cash (c = 0) and the reserve ratio is 10%, the multiplier is exactly 10, which is the case the glossary uses in its entry on credit creation.
Calculating with July’s numbers
Now the actual figures. Dividing M2 by base money gives an end-of-June multiplier of 4,211.5 ÷ 315.2 = 13.36 and an end-of-July multiplier of 4,240.0 ÷ 296.2 = 14.32. In one month the multiplier rose by 0.96.
Treat the multiplier as a fixed lever, multiply June’s 13.36 by July’s base money of 296.2 trillion, and you get an M2 of 3,957.2 trillion won, 254.3 trillion less than at the end of June. In fact M2 rose 28.5 trillion. When the same formula misses by that much within a month, it is worth suspecting that what moved in July was base money rather than M2.
ECONOMY NOTES
One July, two multipliers
June → July 2026, trillion won
Month-end balances (not SA)
- Base money 315.2 → 296.2 (−19.0)
- M2 4,211.5 → 4,240.0 (+28.5)
- Multiplier 13.36 → 14.32
Where the 19.0 went
- Currency in circulation 204.5 → 204.1 (−0.3)
- Bank reserves 110.7 → 92.0 (−18.7)
- Almost all of it is bank reserves
Monthly averages (SA)
- Base money 313.7 → 314.9 (+0.4%)
- M2 4,213.0 → 4,225.6 (+0.3%)
- Multiplier 13.43 → 13.42
Source: Bank of Korea ECOS 102Y001 and 161Y008 (end of month), 102Y004 and 161Y005 (monthly average, SA), retrieved 14 October 2026. Multiplier = M2 ÷ base money. July is preliminary. Figures may not add up because of rounding.
Splitting base money into its two parts shows the answer. Currency in circulation slipped only 0.3 trillion, from 204.5 to 204.1 trillion. Of the 19.0 trillion drop, 18.7 trillion came from deposit-taking institutions’ reserves, which fell from 110.7 to 92.0 trillion. The end-of-July reserves of 92.0 trillion were the lowest month-end figure since January 2024.
Working it through the formula
Putting July’s figures into the formula above gives the same conclusion. c is currency divided by M2, and r is reserves divided by M2 minus currency.
- End of June: c = 204.5 ÷ 4,211.5 = 4.85%, r = 110.7 ÷ 4,007.0 = 2.76%, multiplier 13.36
- End of July: c = 204.1 ÷ 4,240.0 = 4.81%, r = 92.0 ÷ 4,035.9 = 2.28%, multiplier 14.32
With July’s values the denominator is 0.0481 + 0.9519 × 0.0228 = 0.0698, and 1 ÷ 0.0698 = 14.3. Plugging in the rounded c and r gives 13.38 for June and 14.33 for July, slightly different from M2 ÷ base money in the second decimal place. With unrounded values the two calculations agree, because the formula is simply M2 ÷ base money written another way.
ECONOMY NOTES
July's numbers in the multiplier formula
k = 1 ÷ {c + (1 − c) × r}, month-end balances
Find c and r
- c = currency ÷ M2
- r = reserves ÷ (M2 − currency)
- July: c = 204.1 ÷ 4,240.0 = 4.81%
- July: r = 92.0 ÷ 4,035.9 = 2.28%
Plug them in
- 0.0481 + 0.9519 × 0.0228 = 0.0698
- k = 1 ÷ 0.0698 = 14.3
- The same as M2 ÷ base money (14.32)
Compare with June
- June: c 4.85%, r 2.76% → k 13.36
- c barely moved; r fell from 2.76% to 2.28%
- r is that day's balance ratio, not the legal reserve ratio
Source: Bank of Korea ECOS 102Y001 and 161Y008, retrieved 14 October 2026; this note's calculation. With the rounded c and r, k comes out as 13.38 and 14.33.
c hardly moved; what raised the multiplier was r falling from 2.76% to 2.28%. This r is not the legal reserve requirement ratio. The Bank of Korea sets different ratios by type of deposit: 0% for long-term housing savings, 2% for time and instalment savings deposits and 7% for other deposits. And M2 contains more than bank deposits, including money market funds and money trusts with maturities under two years. So the r in the formula is only a ratio worked backwards from that day’s month-end balances, and it can move from day to day even when the legal ratios do not change.
One day at month-end versus a month’s average
If reserves fell 18.7 trillion won in a month, did banks breach their reserve requirement? A single month-end balance cannot tell you. According to the Bank of Korea’s description of the reserve requirement system, each bank’s minimum required reserves are computed from the average of its daily reservable liabilities from the first to the last day of a month, and the bank must hold them from the second Thursday of the following month to the second Wednesday of the month after. Neither the basis of the requirement nor the period in which it is met is tied to the last day of the month. Bank of Korea notes kept in a bank’s vault count as reserves up to 35% of required reserves.
Statistics face the same issue. The glossary distinguishes the average balance (the sum of each day’s balance divided by the number of days) from the end-of-period balance (the balance on the last day), and explains that average balances are compiled separately because money can be handled differently on the last day of a period, temporarily lowering the balance.
ECONOMY NOTES
Hypothetical: average versus end balance
A made-up account over five days, 100 million won
Daily balances
- 12 · 11 · 10 · 11 · 6
- Only the last day is much lower
Average balance
- (12 + 11 + 10 + 11 + 6) ÷ 5 = 10
- What was held on average over five days
End-of-period balance
- Last-day balance 6
- 40% below the average
- An end balance is a snapshot of one day
The numbers are made up for illustration. The Bank of Korea's glossary explains that average balances are compiled because money can be handled differently on the last day of a period, temporarily lowering the end balance.
The made-up account holds 12, 11, 10, 11 and 6 over five days, so its average balance is 10. A snapshot of the last day alone shows 6, 40% below the average. A month-end statistic is that kind of snapshot of a single date. In fact base money at the end of August was back up at 309.5 trillion won, 13.3 trillion more than at the end of July. Why reserves were so low on that last day of July cannot be read from the ECOS figures, so this note does not attribute a cause.
On monthly averages the multiplier barely moved
The Bank of Korea’s release of 15 September, Money and Liquidity for July 2026, leads with monthly-average, seasonally adjusted figures. On that basis July M2 was 4,225.6 trillion won, up 0.3% on the month. Base money on the same basis in ECOS rose 0.4%, from 313.7 to 314.9 trillion. The multiplier from the two was 13.43 in June and 13.42 in July, essentially unchanged.
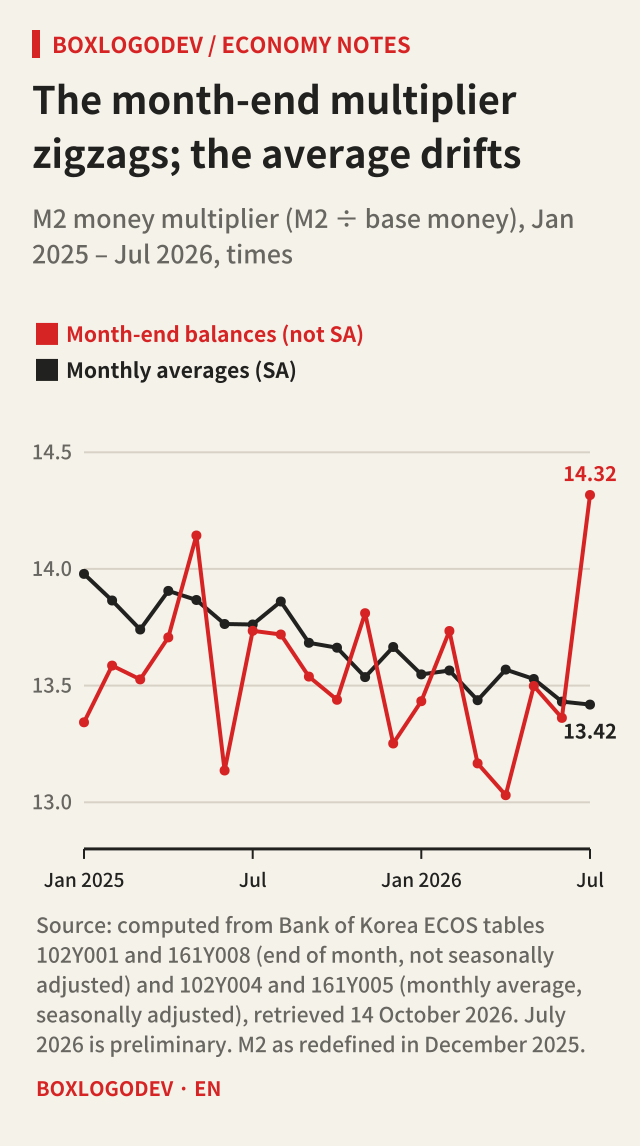
Over January 2025 to July 2026 the difference is even clearer. The multiplier computed from month-end balances swings between 13.03 and 14.32, while the monthly-average multiplier drifts down slowly from 13.98 to 13.42. Over a longer span, the year-end multiplier has fallen from 19.62 in 2008 to 13.25 in 2025. The glossary also notes that money multipliers have tended to decline over the long run since the 2008 global financial crisis.
One caution. The Bank of Korea revised its money and liquidity statistics in December 2025, and its releases still carry a separate “old M2” on the previous basis. The glossary’s example of an M2 multiplier of 14.59 at the end of March 2025 was computed with M2 as compiled before the revision, so it differs from this note’s figure on the revised M2 (13.53 for the same date). Before comparing multipliers, make sure they use the same M2.
Things to keep in mind
- The money multiplier is a result: M2 divided by base money. Used as a calculator that turns a month’s change in base money into a change in M2, it can get even the direction wrong, as in July.
- Do not mix month-end balances with monthly averages, or unadjusted with seasonally adjusted series, in one ratio. The multiplier means something only when numerator and denominator share a basis.
- July’s money figures are preliminary and become final with the next month’s release. As of 14 October, when this note was written, August M2 had not yet been published.
- This note explains how to read the statistics. It does not forecast interest rates or asset prices, and it is not investment advice.
The one calculation to keep
In a month when base money and M2 move in opposite directions, compute that month’s multiplier twice: M2 ÷ base money with month-end balances, and again with monthly averages. If, as in July, only the month-end multiplier jumps, from 13.36 to 14.32, while the monthly-average multiplier stays put at 13.43 to 13.42, what moved was not the money supply but the reserves held on the last day of the month.
Add your perspective.
Share a question, another approach, or something you have tried.
Checking sign-in…
Loading comments…