The Bank of Korea’s preliminary flow of funds for the second quarter of 2026, released on 7 October, gives two numbers for households. Over the three months they spent 88.5 trillion won acquiring financial assets, yet their financial assets at the end of June were 513.2 trillion won larger than at the end of March. After reading this you will be able to tell the transaction figures in a flow-of-funds release from the balance figures, compute the gap between them yourself, and find where that gap came from.
Two numbers in the same release
The flow of funds puts on one table where each part of the economy borrowed money and where it placed it. The Bank of Korea’s glossary of 800 economic and financial terms describes it as a comprehensive statistic built to view the flow of money behind real activity together with changes in financial claims and debts. The Bank has compiled it quarterly and annually since 1965.
For “households and non-profit institutions” (which include small sole proprietors and private non-profits such as religious groups and trade unions), the first set of numbers in the Q2 release is:
- Use of funds (net acquisition of financial assets): 88.5 trillion won, down from 96.3 trillion in Q1.
- Sources of funds (net incurrence of liabilities): 27.8 trillion won, of which borrowing from financial institutions was 28.8 trillion.
- Net lending (uses − sources): 88.5 − 27.8 = 60.7 trillion won.
The second number sits in the release’s table of financial assets and liabilities outstanding. Households’ financial assets grew from 6,417.1 trillion won at the end of March to 6,930.2 trillion at the end of June, an increase of 513.2 trillion. They put in 88.5 trillion and their holdings grew by 513.2 trillion, so the gap is 424.7 trillion won.
The transactions table and the balance table measure different things
The flow of funds has two tables. The financial transactions table records how much was bought and sold over a period: a flow. The financial assets and liabilities outstanding table records what is held at a point in time, at market prices: a stock.
A note in the Excel transactions table attached to the release spells out how they relate. Transactions exclude changes in assets caused by market revaluation and exchange-rate movements, so they can differ from the closing balance minus the opening balance. As a formula:
Closing balance = opening balance + transactions + other changes (price and exchange-rate effects, reclassifications and so on)
So the other changes can be recovered as “change in balance − transactions”. Here is the calculation first with small, made-up numbers.
ECONOMY NOTES
Hypothetical: money put in, money gained
Made-up numbers for illustration, in 10,000 won
1. Start of the quarter
- Shares worth 1,000
- Buys 200 more just before quarter end
- Transactions (acquisitions) = +200
2-A. If prices rise 30%
- End balance 1,000 × 1.3 + 200 = 1,500
- Change in balance +500
- Price effect 500 − 200 = +300
2-B. If prices fall 20%
- End balance 1,000 × 0.8 + 200 = 1,000
- Change in balance 0
- Price effect 0 − 200 = −200
- Transactions are still +200
In the real statistics the gap also holds other non-transaction effects, such as exchange-rate moves and reclassifications.
Suppose someone starts the quarter with shares worth 10 million won and buys another 2 million won worth just before the quarter ends. Treat the newly bought 2 million as having hardly been repriced, so only the original 10 million moves with prices. (Amounts below are in 10,000 won, so 1,000 means 10 million won.)
- If prices rise 30%, the closing balance is 1,000 × 1.3 + 200 = 1,500. The balance grew by 500 and transactions were 200, so the price effect is 500 − 200 = 300.
- If prices fall 20%, the closing balance is 1,000 × 0.8 + 200 = 1,000. The balance is unchanged while transactions are still 200, so the price effect is −200.
The transactions table shows +200 in both cases. It tells you how much was put in; the balance table tells you what it became. The share of the price effect depends on when the purchase was actually made, so buying “just before quarter end” is an assumption to keep the arithmetic simple.
Where Q2’s 424.7 trillion came from
Applying the same calculation to the instrument-level figures in the Bank of Korea’s ECOS database shows which instruments produced the gap.
ECONOMY NOTES
Where the 513.2 trillion came from
Households and non-profits, Q2 2026, trillion won
All financial assets
- Transactions (acquisitions) 88.5
- Balance 6,417.1 → 6,930.2, up 513.2
- Gap not explained by transactions 424.7
Equity and investment funds
- Transactions 101.6
- Balance 1,849.1 → 2,381.1, up 532.0
- Gap 430.5
- Resident shares and equity 323.2 · foreign shares 53.0 · funds 54.3
Other main instruments
- Currency and deposits: transactions −21.7, balance −25.7
- Insurance and pension reserves: transactions +12.2, balance +7.4
- Debt securities: transactions −3.4, balance −0.6
- Their gaps are small and partly offset
Source: Bank of Korea, Flow of Funds for Q2 2026, preliminary (7 October 2026); ECOS tables 281Y001 and 281Y002 (retrieved 12 October 2026). Gap = change in balance − transactions. Figures may not add up because of rounding.
- Equity and investment funds: transactions were 101.6 trillion won, but the balance rose from 1,849.1 trillion to 2,381.1 trillion, up 532.0 trillion. The gap is 430.5 trillion, larger than the total gap of 424.7 trillion. Of it, resident shares and equity account for 323.2 trillion, foreign shares 53.0 trillion and funds 54.3 trillion.
- Currency and deposits: transactions were −21.7 trillion won and the balance changed by −25.7 trillion. In the release’s own breakdown, deposits at financial institutions fell 23.3 trillion.
- For insurance and pension reserves and for debt securities, the gap between transactions and the change in balance is only a few trillion won, and they partly offset each other.
In short, of the 513.2 trillion won increase in household financial assets in Q2, 88.5 trillion was new money; nearly all the rest was the higher valuation of shares and funds households already held. The market over the same period fits this. The KOSPI close in ECOS rose 67.8%, from 5,052.46 on 31 March to 8,476.48 on 30 June. The won’s base rate against the dollar went from 1,513.4 to 1,541.5 won, up 1.9%, which slightly raised the won value of foreign shares. Household holdings of resident shares also include unlisted equity, though, so you cannot simply multiply by the KOSPI’s rise to reproduce the gap, and the statistics do not split the gap into price and exchange-rate effects.
Only Q2 was this large
Putting the last four quarters side by side shows how different Q2 was.
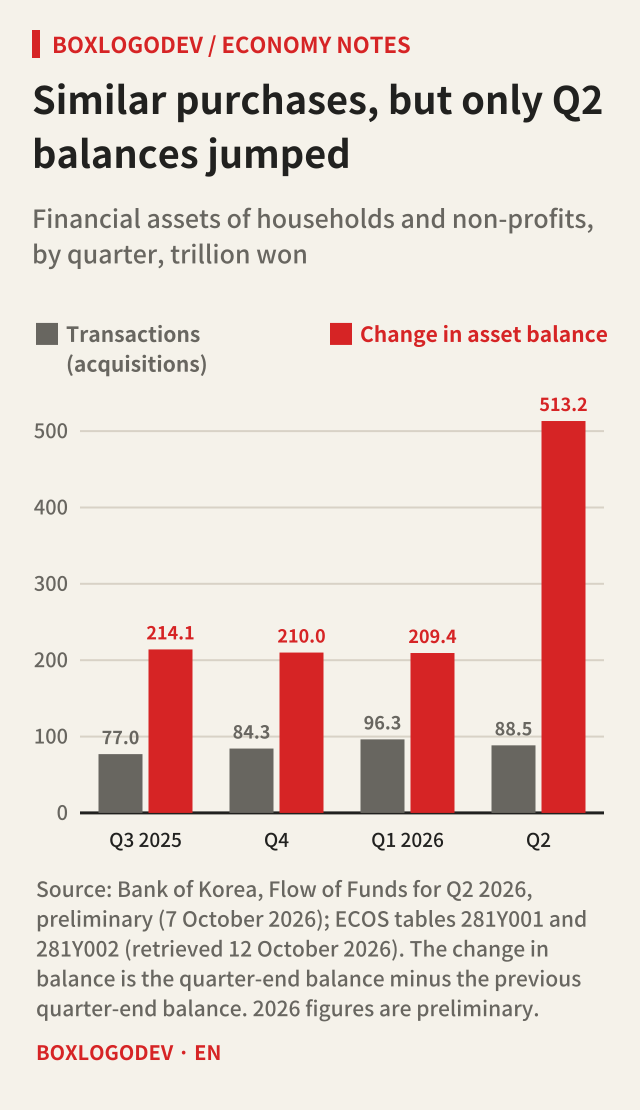
Households’ purchases of financial assets were 77.0, 84.3, 96.3 and 88.5 trillion won, with no large change. The change in balances was around 210 trillion in the first three quarters and then jumped to 513.2 trillion in Q2. Even in those three quarters, other changes of 113 to 137 trillion exceeded transactions. When shares make up a large part of holdings, prices can move balances more than purchases do. Conversely, in a quarter when share prices fall sharply, balances can shrink even while transactions are positive.
The mix of assets changed too. Currency and deposits fell from 42.3% of household financial assets at the end of March to 38.8% at the end of June, while equity and investment funds rose from 28.8% to 34.4%. That is the result of putting less into deposits and buying more shares and funds, plus the rise in share prices.
Worth keeping in mind
- Net financial assets (financial assets − liabilities) behave the same way. Households’ net financial assets rose 484.9 trillion won in Q2, while net lending measured by transactions was 60.7 trillion. For the same reason, the two can differ widely.
- The 2026 figures are preliminary. The Bank of Korea revises them with more source data when it publishes final figures.
- “Households and non-profit institutions” include small sole proprietors and private non-profits. The Bank of Korea says that dividing this sector’s debt by the population and reading it as debt per person is inappropriate, and the same caution applies to assets.
- This note explains how to read the statistics; it does not recommend buying or selling any asset. Last quarter’s valuation gains do not indicate next quarter’s returns.
One calculation to keep
When you read a flow-of-funds release, find one transactions figure and one balance figure for the same sector and compute “change in balance − transactions”. For households in Q2 that is 513.2 − 88.5 = 424.7 trillion won. When the gap is large, the quarter’s change came not from new money but from the value of assets already held, and doing the same calculation by instrument shows which assets moved.
Add your perspective.
Share a question, another approach, or something you have tried.
Checking sign-in…
Loading comments…