In the Bank of Korea's August export and import price indexes, released on 15 September 2026, won-based export prices fell 3.7% from July and import prices fell 2.4%. Export prices fell further than import prices, so it is tempting to read this as Korea getting a worse deal. Yet in the same release the net barter terms of trade index rose 1.5%, from 118.12 to 119.90. One unit of exports actually bought more imports than before.
The two figures do not contradict each other; they use different currencies and different timing. After reading this you will be able to say what the terms of trade index divides by what, explain why it can move against won-based prices, and recompute 119.90 yourself from the numbers in the release tables.
The terms of trade divide export prices by import prices
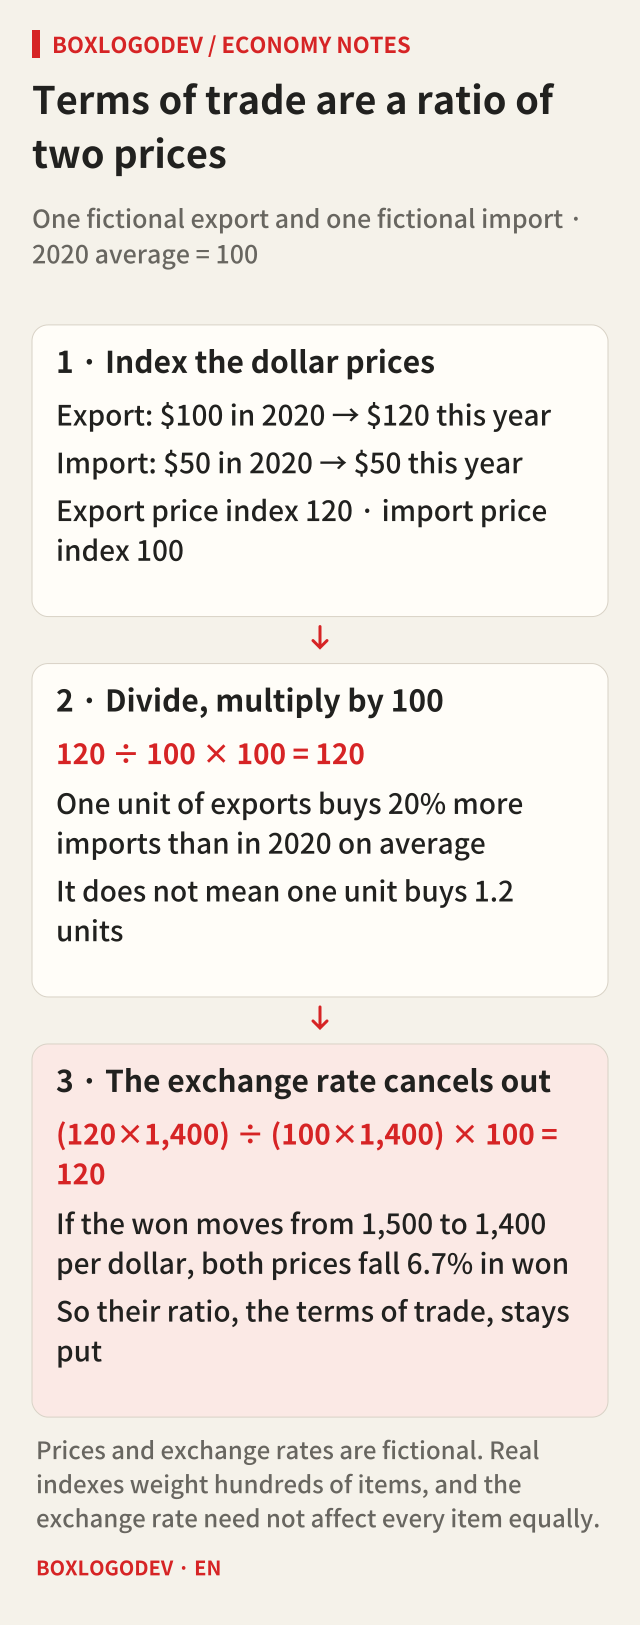
The net barter terms of trade index expresses the ratio between the price of one unit of exports and the price of one unit of imports, with the 2020 average set to 100. The formula is export price index ÷ import price index × 100. It rises when export prices rise more, or fall less, than import prices, and falls in the opposite case.
Take a fictional example. An export that cost $100 in 2020 now costs $120, and an import that cost $50 still costs $50. The export price index is 120 and the import price index is 100, so the terms of trade index is 120 ÷ 100 × 100 = 120. One unit of exports buys 20% more imports than it did on average in 2020. It does not mean one unit of exports buys 1.2 units of imports. The Bank of Korea's glossary of 800 economic and financial terms makes the same point with a reading of 93.25: it does not mean one unit buys 0.9325 units, but that the quantity is 6.75% lower than in 2020.
Now add the exchange rate. If the won moves from 1,500 to 1,400 per dollar, both goods become about 6.7% cheaper in won. The numerator and the denominator are multiplied by the same number, so the ratio is still 120. Because the exchange rate acts on exports and imports together, a currency swing that shakes won-based prices is mostly cancelled out in a price ratio. Real indexes weight hundreds of items settled in different currencies, so the cancellation is not perfect.
The same August on three bases
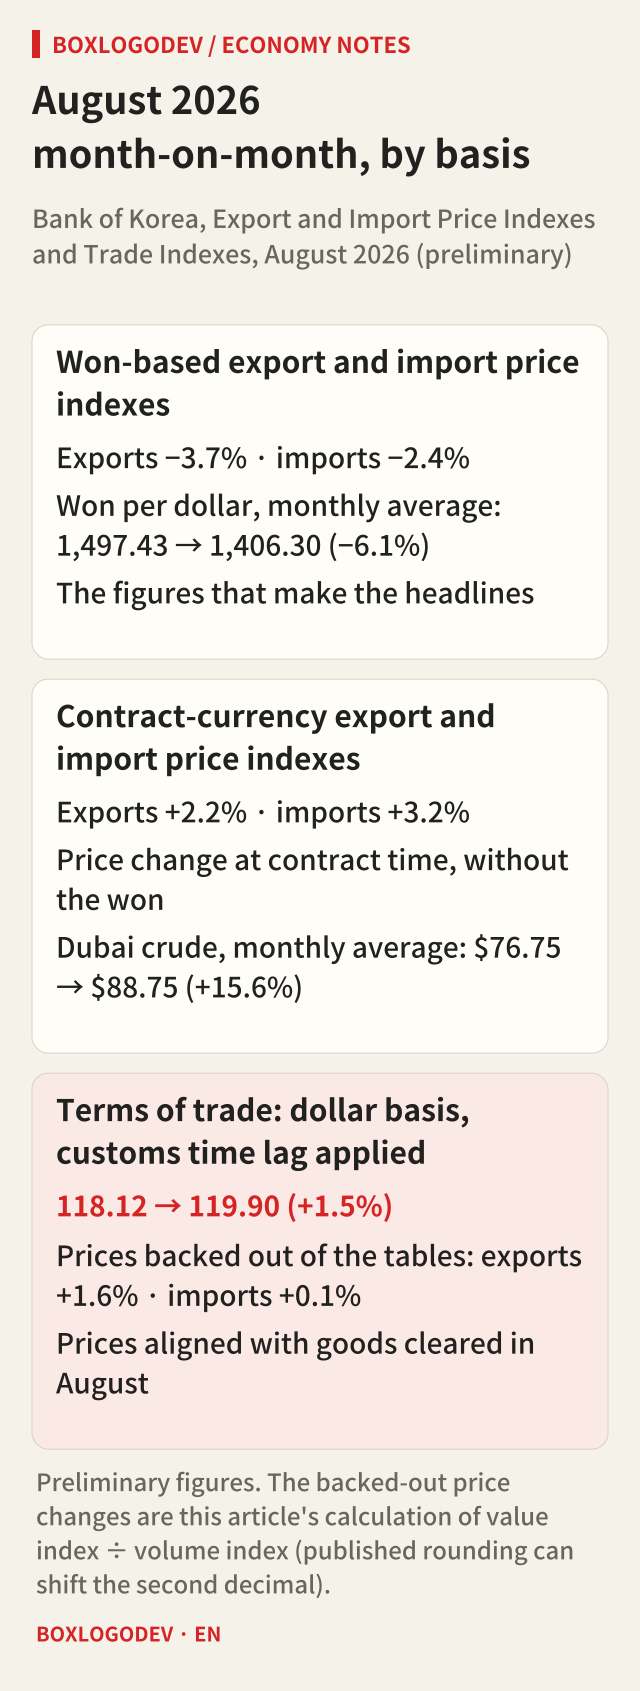
The Bank of Korea surveys prices at the time contracts are signed. Its headline indexes convert those prices into won; it also compiles supplementary indexes on a contract-currency basis and a dollar basis. Setting the August figures side by side by basis changes the story.
On a won basis, exports fell 3.7% and imports 2.4%. The release attributes the fall in export prices to the fall in the won-dollar rate: the monthly average moved from 1,497.43 won per dollar in July to 1,406.30 in August, down 6.1%. The same dollar receipts convert into fewer won, so won-based prices fall. As in the example above, however, this exchange-rate share mostly disappears in a ratio.
On a contract-currency basis, which leaves out the won, export prices rose 2.2% and import prices 3.2%. This was a month in which the average price of Dubai crude rose 15.6%, from $76.75 to $88.75 a barrel. At contract time, imports rose more than exports, and dividing won-based export prices by won-based import prices gives a fall of 1.4%, from 118.85 to 117.22. The terms of trade improved anyway because they use prices from a different point in time.
The terms of trade index is on a dollar basis and uses price indexes shifted to customs time, which the release calls time-lag-applied indexes. Prices are surveyed when contracts are signed, but trade values are counted when goods clear customs, so prices are shifted by the time that typically passes between the two. The release gives the example of car exports, which take two months on average from contract to customs. August's terms of trade therefore reflect the prices of goods that cleared customs in August. Backing those prices out of the tables, as shown below, export prices rose 1.6% from July while import prices rose 0.1%, almost unchanged. Since 1.016 ÷ 1.001 is about 1.015, the terms of trade improved 1.5%.
These tables cannot tell you in which month a price rise at contract time will show up in customs-time prices, because the lag differs from item to item. A rise in contract-currency import prices alone is not enough to predict next month's terms of trade.
Recomputing 119.90 from the tables
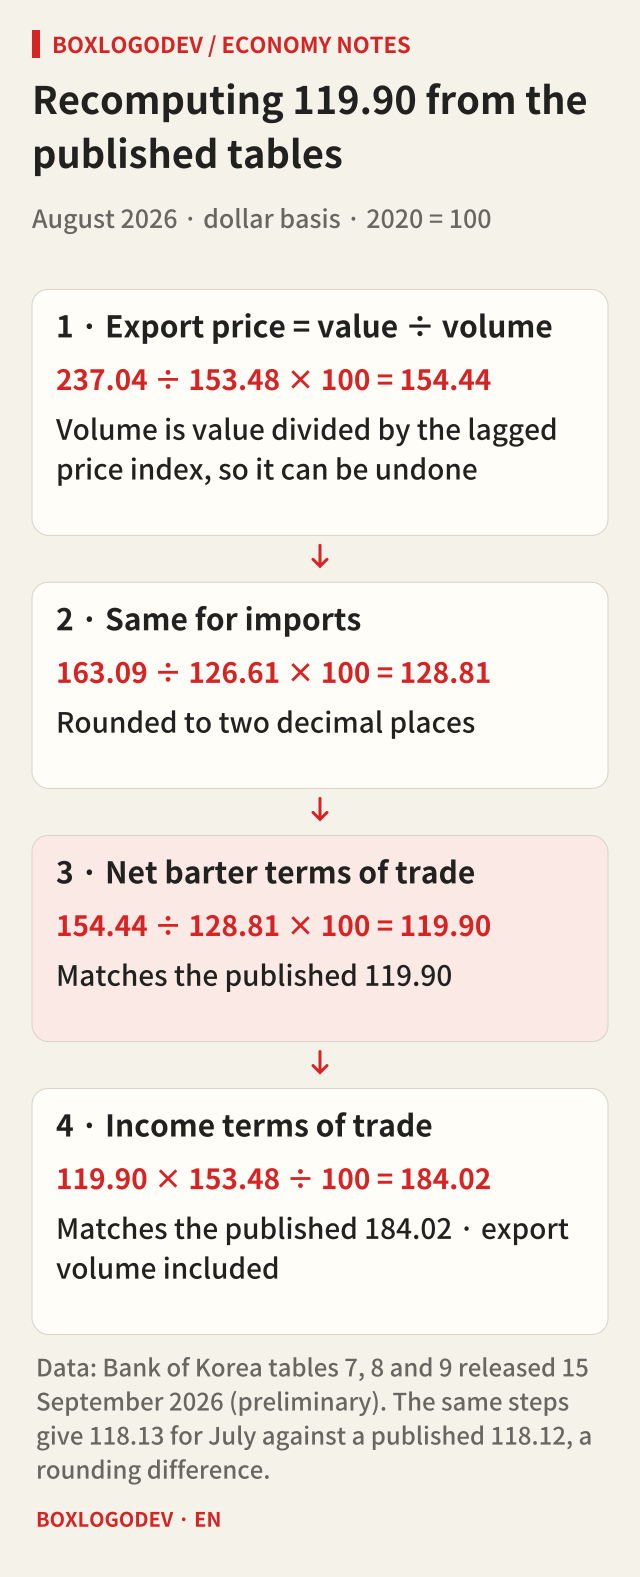
The release does not print the time-lag-applied price indexes, but the published tables are enough to recover them. According to the trade index methodology, the volume index is the value index divided by the time-lag-applied price index, so dividing the value index by the volume index gives back the time-lag-applied price. All of these indexes are in dollars with 2020 = 100.
August exports have a value index of 237.04 and a volume index of 153.48, so 237.04 ÷ 153.48 × 100 = 154.44. For imports, 163.09 ÷ 126.61 × 100 = 128.81 (both rounded to two decimal places). Dividing the two gives 154.44 ÷ 128.81 × 100 = 119.90, the published net barter terms of trade. The same steps for July give 118.13 against a published 118.12, a rounding difference.
The release also reports the income terms of trade: the net barter index multiplied by the export volume index and divided by 100. It fills a gap in the price-only net barter index by showing how much could be imported with total export earnings. Here 119.90 × 153.48 ÷ 100 = 184.02, again matching the published figure. August's income terms of trade were 60.0% higher than a year earlier, the combined result of a better price ratio (27.1%) and higher export volume (25.9%).
The longer view
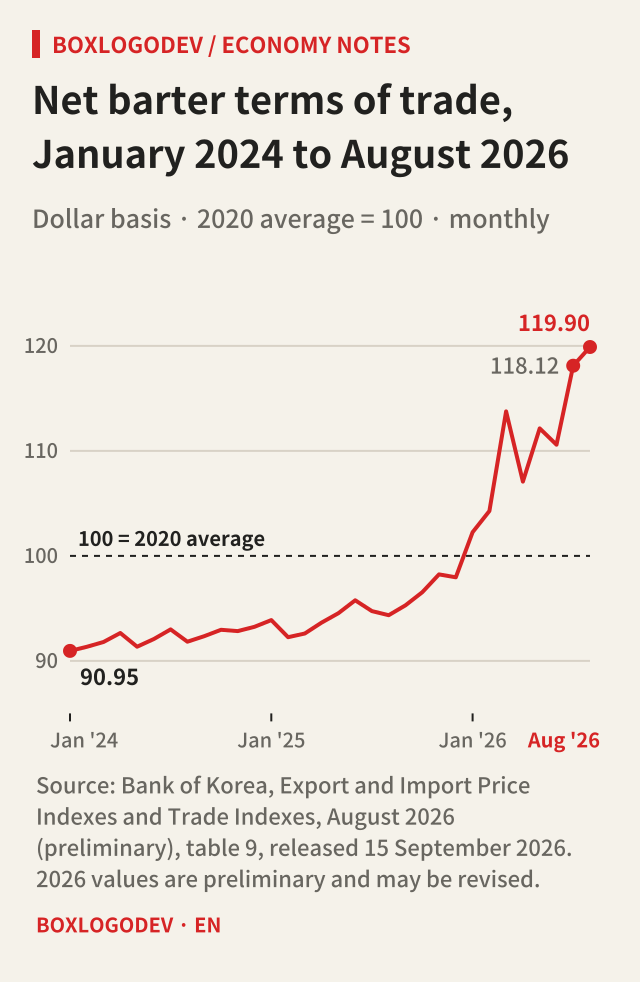
The net barter terms of trade stood at 90.95 in January 2024, a little over 9% below the 2020 average, and stayed in the 90s throughout 2025. It passed 100 at 102.26 in January 2026 and reached 119.90 in August, the highest of the 32 months in the chart. Compared with August 2025 the index was 27.1% higher, and the release explains this by dollar-based export prices rising 39.6%, far faster than import prices at 9.9%.
All 2026 values are preliminary. The latest month can be revised when the next month is released, and each year's figures are finalised in March of the following year once customs data are confirmed. A past trend does not mean it will continue.
What to check when you see a terms of trade figure
When the terms of trade improve, the same volume of exports buys more imports, which adds to the economy's real purchasing power; when they worsen, the opposite happens. The net barter index looks only at the price ratio, though, so read it together with the income terms of trade to see how much was actually sold. This article does not recommend any investment or transaction.
When you read about trade prices or the terms of trade, check three things first: whether the figure is in won, a contract currency or dollars; whether it reflects contract-time or customs-time prices; and whether it is preliminary. Remember that the exchange-rate share of a move in won-based prices largely vanishes once you take a ratio, and a month in which export prices and the terms of trade move in opposite directions will no longer be confusing. September's figures are due on 16 October 2026. The release and its tables are in the Bank of Korea's Export and Import Price Indexes and Trade Indexes, August 2026 (preliminary) (in Korean), and the monthly series is in the terms of trade table on ECOS, the Bank of Korea Economic Statistics System.
Add your perspective.
Share a question, another approach, or something you have tried.
Checking sign-in…
Loading comments…