In the September employment figures that Korea's Ministry of Data and Statistics published on 16 October 2026, employment was 113,000 higher than a year earlier. Yet the employment rate fell from 63.7% to 63.5%, down 0.2 percentage point. In the same release the rate for ages 15–64 rose from 70.4% to 70.6%, and the unemployment rate fell from 2.1% to 2.0%. One table holds numbers moving both ways.
After reading this you will be able to recompute all three rates from the published head counts. You will also try one multiplication that tells you whether an employment gain was enough to hold the rate, and a split that measures how far the age mix pulled the overall rate down.
A bigger numerator alone does not lift a ratio
The employment rate is the number of employed people divided by the population aged 15 and over. Use the figures in thousands from the release's statistical tables. For September 2026, 29,266.0 ÷ 46,054.8 × 100 = 63.546%. For September 2025, 29,153.5 ÷ 45,797.0 × 100 = 63.658%. Rounded to one decimal, they give the published 63.5% and 63.7%.
Over the year the numerator, employment, rose by 112,500, or 0.386%. The 113,000 in the release is that figure rounded. The denominator, the population aged 15 and over, rose by 257,800, or 0.563%. The denominator grew faster, so the ratio went down.
How many more employed people would have held the rate? Multiply the added population by last year's rate: 257.8 × 63.658% = 164.1, or 164,100. The actual increase of 112,500 fell 51,600 short, and 51.6 ÷ 46,054.8 × 100 = 0.112 point, which is how far the rate fell.
Rounding deserves a note here. The published −0.2 point is the gap between the rounded 63.5 and 63.7; the unrounded gap is −0.11 point. The figure of 0.2 point is not wrong, but the actual move is a little over half of that. Worked out the same way, the unemployment rate moved −0.12 point (published −0.1) and the labour force participation rate −0.19 point (published −0.2).
ECONOMY NOTES
How employment rose while the rate fell
September 2025 vs September 2026 · people in thousands, rates unrounded to three decimals
Inputs
- Population 15+: 45,797.0 → 46,054.8 (+257.8)
- Employed: 29,153.5 → 29,266.0 (+112.5)
- Unemployed: 634.6 → 600.4; inactive: 16,009.0 → 16,188.4
Employment rate = employed ÷ population 15+
29,266.0 ÷ 46,054.8 × 100 = 63.546- A year earlier 63.658, published 63.7; now published 63.5
- Published gap −0.2 point; unrounded −0.112 point
How many more to hold the rate?
257.8 × 63.658% = 164.1- Needed 164.1, actual 112.5, short by 51.6
- 51.6 ÷ 46,054.8 × 100 = 0.112 point
The unemployment rate has another base
600.4 ÷ 29,866.4 × 100 = 2.010- The base is employed + unemployed (labour force)
- A year earlier 2.130: published 2.1, now 2.0
Source: Ministry of Data and Statistics, Employment Trends in September 2026 (16 October 2026), statistical tables. Rates and the required increase are this article's calculation. Table figures are rounded, so totals can differ by 0.1.
The unemployment rate has a different base
The survey sorts everyone aged 15 and over into three groups with nobody left out. People who worked for pay for at least one hour in the survey week are employed. Unpaid family workers helping in a family business need at least 18 hours a week, and people temporarily off work through illness or leave also count as employed. People who did not work, actively looked for a job in the past four weeks and could start at once are unemployed. Everyone else is economically inactive. Someone who fits several descriptions is classed as employed first, then unemployed, then inactive.
The base of the unemployment rate is not the population aged 15 and over but the labour force, the employed plus the unemployed. For September 2026, 600.4 ÷ 29,866.4 × 100 = 2.010%; a year earlier, 634.6 ÷ 29,788.0 × 100 = 2.130%. Because the bases differ, the employment rate and the unemployment rate can fall together. The labour force participation rate, the labour force divided by the population aged 15 and over, also fell, from 65.0% to 64.8%.
Split the added 257,800 people into the three groups: employed +112,500, unemployed −34,200, inactive +179,400. The sum is 257,700, 100 apart because the tables are rounded. Within the inactive group, housework was up 99,000, attending school or training up 73,000 and old age up 52,000, while “resting” was down 25,000.
One caution. This table compares head counts at two dates; it does not follow people. A fall of 34,200 in unemployment does not by itself mean that many people found jobs, or that they stopped looking. The Bank of Korea's glossary of 800 economic and financial terms (2026 edition, in Korean, page 20) explains that when more people are preparing for jobs or have given up looking, the unemployment rate can fall, and that the employment rate is unaffected by moves between unemployment and inactivity. In this September, however, those preparing for jobs fell by 7,000, discouraged workers by 1,000, and the broadest supplementary measure, the extended unemployment rate, fell from 7.9% to 7.3%. Nothing in this release supports blaming this month's lower unemployment rate on such moves.
Both age groups rose, yet the total fell
The age figures are more striking. The employment rate for ages 15–64 rose from 70.4% to 70.6%, and the rate for ages 65 and over rose from 41.4% to 41.6%. Both rose, yet the combined rate for ages 15 and over fell. This is no error; it is how averages work. The overall rate is a weighted average of the two, and the weights are population shares.
The head counts make it plain. In the 15–64 group the population fell by 318,100 and employment by 141,100: employment fell while the rate rose, the exact opposite of the headline. In the 65-and-over group the population rose by 575,900 and employment by 253,600 (15 and over minus 15–64). The total gain of 112,500 is −141,100 plus +253,600. Meanwhile the 65-and-over share of the population aged 15 and over grew from 23.216% to 24.337%, and that group's rate, about 41%, is far below the roughly 70% of the 15–64 group.
You can measure the effect by applying last year's group rates to this year's population. Ages 15–64: 34,846.5 × 70.382% ≈ 24,526. Ages 65 and over: 11,208.3 × 41.420% ≈ 4,642. The sum is about 29,168, and dividing by 46,054.8 gives 63.33%. So with no change at all inside either group, the overall rate would have dropped from 63.66% to 63.33%. Using unrounded values, composition accounts for −0.32 point, the rise within the groups for +0.21 point, and the total is −0.11 point.
ECONOMY NOTES
Both age groups rose, yet the total fell
This article's split into ages 15–64 and 65+ · people in thousands
Ages 15–64
- Population −318.1, employed −141.1
- Rate 70.382% → 70.620% (+0.24 point)
Ages 65+
- Population +575.9, employed +253.6
- Rate 41.420% → 41.554% (+0.13 point)
The weight shifted
- Share of 65+ in the population 15+
- 23.216% → 24.337% (+1.12 points)
Apply last year's rates to this year's population
34,846.5 × 70.382% + 11,208.3 × 41.420% ≈ 29,168- 29,168 ÷ 46,054.8 × 100 = 63.33%
- It falls from 63.66% with no change inside either group
Split
−0.32 + 0.21 = −0.11- Composition −0.32 point, within groups +0.21 point
- Worked out unrounded, then rounded to two decimals
Source: Ministry of Data and Statistics, Employment Trends in September 2026 (16 October 2026), statistical tables. Ages 65+ are 15+ minus 15–64. The split is this article's calculation; a finer age split gives different values.
This calculation has limits. It uses only two groups, and a finer age split gives different values. With six groups from the same tables (15–19, the 20s, 30s, 40s and 50s, and 60 and over), composition shrinks to −0.24 point and change within the groups is +0.13 point, with the same total of −0.11 point. Split 60 and over again into 60–64 and 65 and over, making seven groups, and composition grows to −0.36 point, with +0.25 point within the groups, because a single 60-and-over group does not count the shift toward 65 and over inside it as composition. The sign is the same either way, so the direction holds, but read −0.32 point as a rough size rather than an exact one. It is also only accounting, and it says nothing about job quality or why people work. Nor did every age group gain just because the 15–64 rate rose: in the same release the rate for ages 15–29 fell from 45.1% to 44.0%, down 1.1 points.
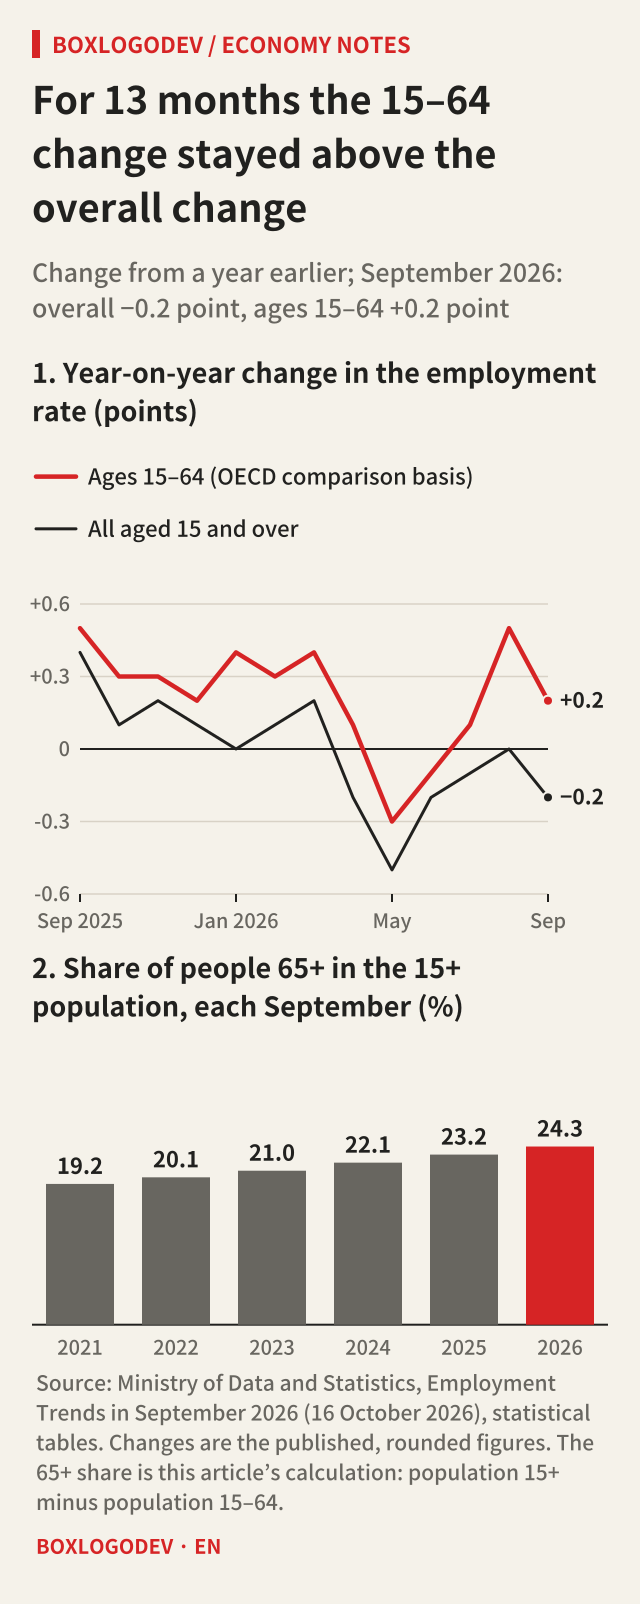
The gap is not new this month. Across the 13 months from September 2025, the year-on-year change in the 15–64 rate was above the overall change every month, by 0.1 to 0.5 point in the published figures. The 65-and-over share grew from 19.2% in September 2021 to 24.3% in September 2026.
How to read the next employment release
First, set the employment gain against population growth. From June to September 2026 the population aged 15 and over was 254,000 to 258,000 higher than a year earlier. Multiplied by an employment rate of about 63%, that comes to around 160,000, the gain needed to keep the overall rate where it was. Compare with this benchmark before calling a gain good or bad.
Second, read the 15–64 rate and the rates by age alongside the overall rate. The Ministry's own summary leads with the 15–64 rate, the OECD comparison basis. The overall rate also carries the effect of the age mix.
Third, check the comparison period. The release's questions and answers recommend the year-on-year change in the original series for trends, and the month-on-month change in the seasonally adjusted series for the short term. In September, seasonally adjusted employment rose by 40,000 from August, and the seasonally adjusted rate for ages 15 and over stayed at 62.9%. The survey is a sample of about 36,000 households, so it carries sampling error. It is better not to read a 0.1-point move as a big change.
The October figures are scheduled for 11 November 2026. The source data, including the statistical tables as a spreadsheet, are at the Ministry of Data and Statistics release for September 2026 (in Korean). When next month's table appears, start with population growth times the employment rate.
Add your perspective.
Share a question, another approach, or something you have tried.
Checking sign-in…
Loading comments…