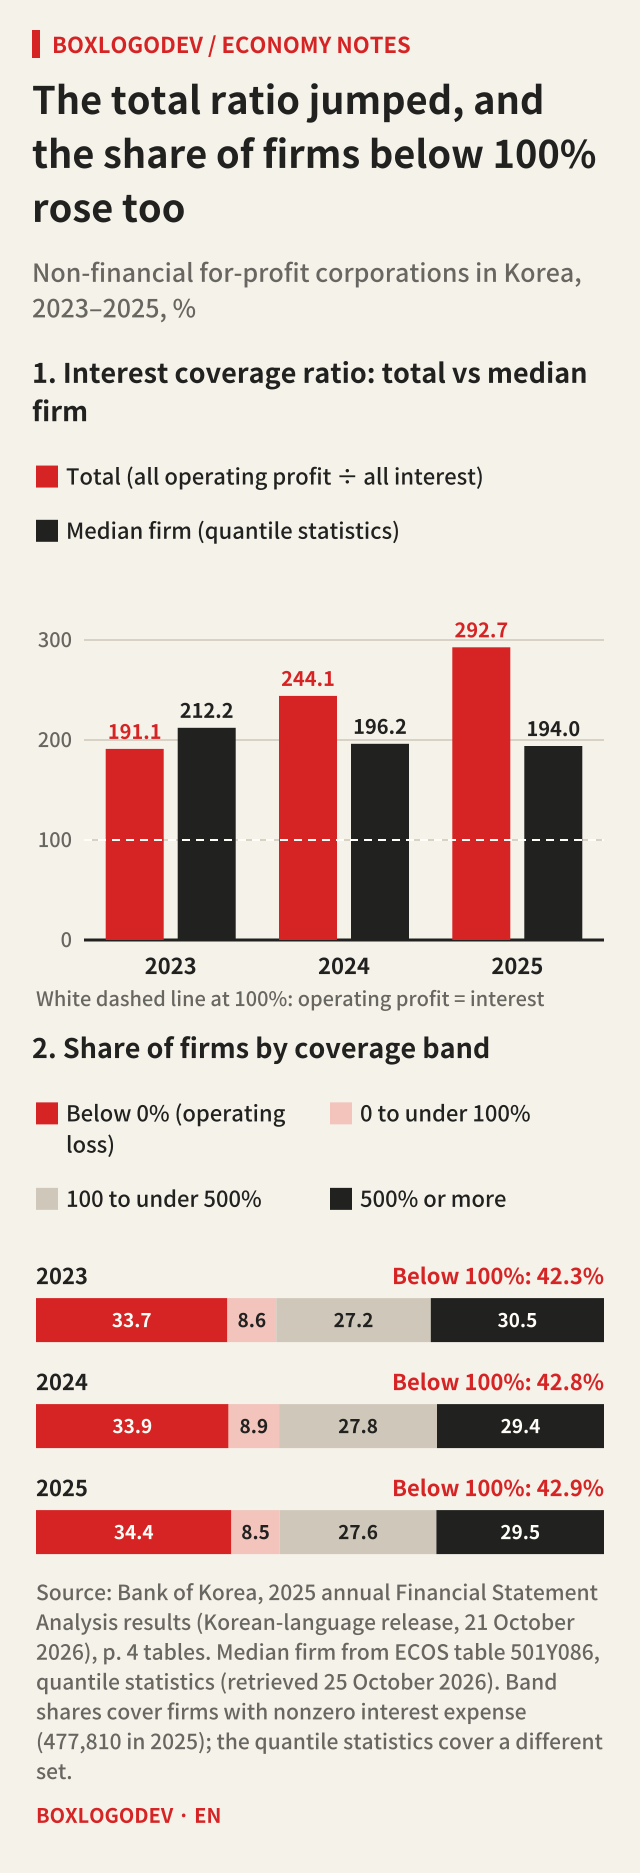
On 21 October 2026 the Bank of Korea published its annual Financial Statement Analysis results for 2025 (a Korean-language release), and two of its numbers seem to point in opposite directions. The interest coverage ratio of Korea’s non-financial for-profit corporations rose from 244.1% in 2024 to 292.7% in 2025, up 48.6 percentage points. Yet in the table right below, the share of firms whose ratio is under 100% edged up from 42.8% to 42.9%. After reading this note you will be able to tell a ratio of totals from a share of firms, and read both numbers in one release.
The 2025 figures
The statistics cover the non-financial for-profit corporations that filed corporate tax returns with the National Tax Service. After excluding firms whose fiscal year ends in January to May, excluded industries such as finance and insurance, and a few other groups, 982,767 firms were covered for 2025. The Bank of Korea attributes the higher coverage ratio to a higher operating margin: operating profit rose from 4.6% to 5.2% of sales, and interest expense as a share of sales, the financial cost burden, fell from 1.9% to 1.8%.
The bands tell a slightly different story. The share of firms below 100% rose from 42.8% to 42.9%, and the share at 500% or more from 29.4% to 29.5%, while the 100–300% band (20.8% → 20.7%) and the 300–500% band (7.0% → 6.9%) shrank. Within the below-100% group, firms below 0%, meaning those with an operating loss, rose from 33.9% to 34.4%, up 0.5 points. These shares are counted over the 477,810 firms (2025) whose interest expense was not zero. Multiplying by 42.9% gives roughly 205,000 firms below 100%. Because the share is rounded to one decimal, that count is off by a few hundred either way.
What the ratio measures
The Bank of Korea’s glossary, 800 Economic and Financial Terms (2026 edition), describes the interest coverage multiple as operating profit divided by interest expense. It shows how far profit from operations can carry interest costs, and a value below 1 means that even all of operating profit cannot cover financial costs. The interest coverage ratio is the same number times 100, written as a percentage. So 292.7% means operating profit was about 2.93 times interest expense, and 100% is the line where the two are equal.
The release splits the ratio into two other ratios:
Interest coverage ratio = operating margin ÷ financial cost burden × 100
Both the numerator and the denominator of operating profit ÷ interest expense are divided by sales, so the identity is exact. Plug in the published 2025 values and you get 5.2 ÷ 1.8 × 100 = 288.9, 3.8 below the published 292.7. The arithmetic is fine; the inputs are rounded. 5.2 could be anything from 5.15 to under 5.25 and 1.8 anything from 1.75 to under 1.85, so the answer could land anywhere from 278.4 to 300.0. Even the financial cost burden with two decimals in the Bank of Korea’s ECOS database (listed as interest expense to sales, 1.78%) gives 5.2 ÷ 1.78 × 100 = 292.1; matching the published figure exactly needs the unrounded data.
ECONOMY NOTES
Plugging 2025 into the identity
Coverage ratio = operating margin ÷ financial cost burden × 100
Why it holds
- Operating profit ÷ interest expense
- = (operating profit ÷ sales) ÷ (interest ÷ sales)
- Sales cancel out top and bottom
Plug in the published figures
- Operating margin 5.2%, financial cost burden 1.8%
- 5.2 ÷ 1.8 × 100 = 288.9
- The published ratio is 292.7
The 3.8 gap is rounding
- 5.2 can be 5.15 to under 5.25; 1.8 can be 1.75 to under 1.85
- Within those ranges the answer is 278.4–300.0
- 292.7 sits inside that range
2024 → 2025
- Operating margin 4.6 → 5.2 (+0.6 pp)
- Financial cost burden 1.9 → 1.8 (−0.1 pp)
- Coverage ratio 244.1 → 292.7 (+48.6 pp)
Source: Bank of Korea, 2025 annual Financial Statement Analysis results (21 October 2026), p. 4 table. Calculations are this note's. Ratios in %, changes in percentage points (pp).
Why both numbers can be true
According to the survey notes in the release, the indicators are built by adding up each corporation’s financial statements by industry and firm size, then computing ratios from the summed statements. So 292.7% is a ratio of totals: the operating profit of all covered firms added together, divided by their interest expense added together. Among firms that pay interest, that equals the average of their individual coverage ratios, each weighted by its share of total interest expense. The more interest a firm pays, the more it moves the result. The band shares, by contrast, count each firm once, whether it is a large group company or a small corporation.
Take five made-up firms, in units of KRW 100 million. In year 1, A earns an operating profit of 90 and pays 40 in interest (225%), B earns 6 and pays 4 (150%), C earns 3 and pays 4 (75%), D makes an operating loss of 1 and pays 1 (−100%), and E earns 12 and pays 1 (1,200%). The total is 110 ÷ 50 = 220%, and two firms, C and D, are below 100% (40%). In year 2, suppose A’s operating profit rises to 140 and B’s falls to 3, taking B to 75%. The total jumps to 157 ÷ 50 = 314%, up 94 points, while the firms below 100% become three, B, C and D (60%). A, which pays 80% of all the interest, moved the total; B alone moved the share.
ECONOMY NOTES
Five firms: the total and the share
A made-up example in KRW 100 million. Operating profit ÷ interest
Year 1
- A 90 ÷ 40 = 225%
- B 6 ÷ 4 = 150%
- C 3 ÷ 4 = 75%
- D −1 ÷ 1 = −100%
- E 12 ÷ 1 = 1,200%
- Total 110 ÷ 50 = 220%
- Below 100%: 2 firms (C, D) = 40%
Year 2
- A 140 ÷ 40 = 350% (operating profit +50)
- B 3 ÷ 4 = 75% (drops below 100%)
- C, D and E stay as in year 1
- Total 157 ÷ 50 = 314%
- Below 100%: 3 firms (B, C, D) = 60%
Why they split
- The total ratio is the firms' ratios averaged with interest-expense weights
- A pays 40 of the 50 in interest (80%)
- The share counts every firm once
Made-up numbers. Year 1 weighted average: 0.8×225 + 0.08×150 + 0.08×75 + 0.02×(−100) + 0.02×1,200 = 220.
The official data show the same structure. In the ECOS profit-and-loss indicators by firm size, the coverage ratio of large enterprises rose from about 342% in 2024 to about 422% in 2025, while small and medium-sized enterprises barely moved, from about 133% to 136%, and small enterprises fell from about 56% to 50% (ECOS values rounded to whole numbers). Operating margins rose from 5.6% to 6.7% at large enterprises and fell from 3.0% to 2.8% at small and medium-sized ones. By industry, the operating margin of electronic, video and communications equipment makers jumped from 8.3% to 14.0%.
The Bank of Korea notes this limit in the release itself: indicators built from summed statements can be heavily swayed by the results of a few large firms, which is why since 2014 it has also published quantile statistics that rank the firms’ individual ratios. In those statistics the median coverage ratio across all industries, the value of the firm in the middle, edged down from 212.2% in 2023 to 196.2% in 2024 and 194.0% in 2025. Over the same years the total rose from 191.1% to 292.7%. Add that the shares below 0% and at 500% or more both rose while the bands in between shrank (0 to under 100%: 8.9% → 8.5%; 100–300% and 300–500% as above), and 2025 reads as a year in which both ends gained a little share: firms covering their interest many times over, and firms making operating losses. That is this note’s reading of the numbers, not a description used in the release.
Things to keep in mind
- Below 0% means negative operating profit, an operating loss. Of the 42.9% of firms below 100% in 2025, 34.4 points were loss-makers and 8.5 points made a profit that fell short of their interest. Reading everything below 100% as “profitable firms whose profit is smaller than their interest” is wrong.
- The band shares leave out firms with zero interest expense. In 2025 only 477,810 of the 982,767 covered firms (48.6%) are in them. If the ratios are computed from summed statements as described, the numerator of the total ratio also includes the operating profit of firms with no interest expense, so the total ratio and the band shares do not even start from the same set of firms. The quantile statistics differ again: the release says account values such as interest expense that are zero or negative are replaced with 10 to the power of −12 before computing.
- Interest expense here is gross, before subtracting interest received. The glossary notes that when firms earn substantial interest income their ability to bear financial costs may be understated, and suggests the net interest coverage multiple, computed with interest income subtracted, as a supplementary indicator.
- The preliminary 2025 results released on 10 June 2026 covered 34,456 firms subject to external audit. This annual release covers a different population, so do not line up the numbers from the two releases side by side.
- The shares are rounded to one decimal. Allowing for rounding, the move from 42.8% to 42.9% is larger than zero and smaller than 0.2 points. The direction is clear, but the size is very small.
The question to keep
Next time you see a headline about a rising interest coverage ratio, first ask whether the number is a ratio of totals or a share of firms. In the Bank of Korea’s Financial Statement Analysis release the band table sits on the same page, and ECOS has the median. If the total, the median and the share below 100% all point the same way, you can say firms in general are better off. When the three split, as in 2025, check who actually got better.
Add your perspective.
Share a question, another approach, or something you have tried.
Checking sign-in…
Loading comments…