In Consumer Price Trends, October 2026 (in Korean), released by Korea's Ministry of Data and Statistics on 3 November 2026, consumer prices were 2.8% higher than a year earlier. The same release carries two more lines for core inflation: the index excluding food and energy rose 2.8%, and the index excluding agricultural products and oils rose 2.8%. With all three numbers equal, it is fair to ask why Korea publishes two core measures at all. Two months earlier, in August, the same two indices split at 3.4% and 3.1%.
After reading this you will be able to say which items each core index leaves out, and to recompute the three 2.8% figures yourself from the index levels in the release, down to the gap that rounding hides.
What core inflation removes
Core inflation is consumer price inflation calculated without the items whose prices swing the most. The Bank of Korea's glossary, Economic and Financial Terms 800, describes the core inflation rate as the underlying rate of price increase, without the effect of temporary supply shocks. Vegetable prices that jump after bad weather, or fuel prices that follow world oil prices, can reverse within months, so the idea is to look at the trend without them.
There is no single right answer to what should be removed. According to the glossary, Korea has long compiled the index excluding agricultural products and oils as its core measure, and since the 2010-based index it has also compiled an index excluding food and energy along OECD lines. The Ministry of Data and Statistics provides the first from January 1975 and, although the second was added only with the 2010-based index, provides it from January 1990. That is why today's release shows two core lines.
Which items each index leaves out
Put the definitions in the release's appendix side by side and the difference is clear. The consumer price index is built from 458 items. The index excluding food and energy removes 149 of them. The 140 food items are agricultural products other than ginseng and flowers, livestock products, fish and seafood, and processed food other than alcoholic drinks; the 9 energy items are oil products, electricity, city gas and district heating. The index excluding agricultural products and oils removes 57 items: agricultural products other than grains, city gas and oil products.
ECONOMY NOTES
The two core indices leave out different items
What each one removes from the 458 items of the consumer price index (2020 = 100)
Excluding food and energy · OECD method
- Removes 149 items and keeps 309
- Food, 140 items: agricultural products except ginseng and flowers, livestock, fish and seafood, processed food except alcoholic drinks
- Energy, 9 items: oil products, electricity, city gas, district heating
Excluding agricultural products and oils · Korean method
- Removes 57 items and keeps 401
- Removed: agricultural products except grains, city gas, oil products
What the names do not tell you
- The Korean method also drops city gas, which its name leaves out
- Grains, livestock, seafood, processed food (not alcohol), electricity and district heating are removed only by the OECD method
- Eating out is a service, so both indices keep it
Source: Ministry of Data and Statistics, Consumer Price Trends, October 2026 (3 November 2026), appendix on the CPI and notes to the p. 2 tables (Korean). Item counts are for the 2020-based index.
The names hide a few things. First, despite its name, the Korean method also removes city gas. Second, grains, livestock products, seafood, processed food other than alcoholic drinks, electricity and district heating are removed only by the OECD method and stay in the Korean one. Read literally, the definitions also mean that ginseng and flowers work the other way round and are removed only by the Korean method. Third, eating out is classed as a service, so neither core index removes it. When restaurant prices rise, both core measures show it.
In short, the OECD method takes food and energy out broadly and looks at the remaining 309 items, while the Korean method removes only the most volatile agricultural products, oil products and city gas and looks at 401 items. That is why the two can differ in the same month.
The order flipped within a year
The table on page 1 of the release shows year-on-year rates for the last 13 months. From October 2025 to March 2026, the index excluding agricultural products and oils ran 0.1 to 0.3 percentage points above the index excluding food and energy. In April and May they were equal, and from June to September the index excluding food and energy was 0.1 to 0.3 points higher instead. The widest gap came in August, 3.4% against 3.1%, and in October both were 2.8%.
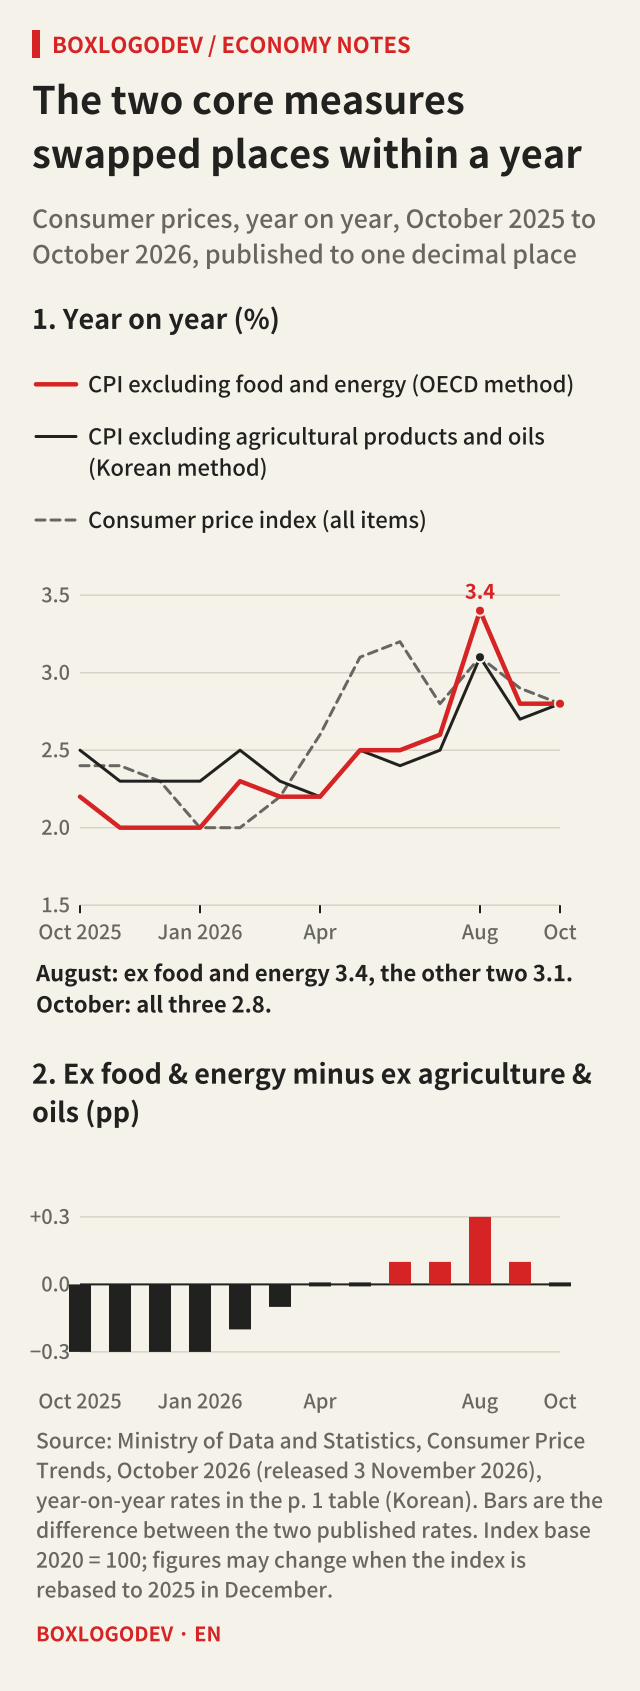
Annual figures show no fixed order either. In 2023 the index excluding food and energy rose 3.4% and the index excluding agricultural products and oils 4.0%, so the Korean method was 0.6 points higher; in 2024 the figures were 2.2% and 2.1%, putting the OECD method 0.1 points ahead; in 2025 they were 1.9% and 2.2%.
The gap between the two comes from the items only one of them contains. When the items that stay only in the Korean method (grains, livestock, seafood, processed food, electricity and district heating) rise less than the rest, the Korean measure comes out lower; when they rise more, it comes out higher. In August, processed food and livestock products were each only 1.5% higher than a year earlier, well below 3.4% (seafood rose 3.8%). In October, though, processed food rose 2.9%, livestock 4.8% and seafood 5.4%, and the two core measures were still both 2.8%. Grains do not appear separately in the release tables and electricity is grouped with gas and water, so the few lines you can see do not explain the whole gap. The release's own notes say that upper-level indices calculated from item indices and weights do not match the published indices.
Recomputing the three 2.8% figures
A year-on-year rate is this month's index divided by the index for the same month a year earlier, minus 1, times 100. The table on page 2 of the release gives the index levels to two decimal places, so anyone can redo the calculation.
The all-items index was 120.73 in October and 117.42 a year earlier. 120.73 ÷ 117.42 = 1.02819, or 2.819%, which rounds to 2.8% at one decimal place. For the index excluding food and energy, 116.98 ÷ 113.79 gives 2.803%; for the index excluding agricultural products and oils, 119.22 ÷ 116.00 gives 2.776%. All three are published as 2.8%, but before rounding they span 0.04 points, from 2.776% to 2.819%.
ECONOMY NOTES
Recomputing the three 2.8% figures
Year on year = (this month's index ÷ index a year earlier − 1) × 100, published to one decimal place
All items, October 2026
- 120.73 ÷ 117.42 = 1.02819
- 2.819% → 2.8%
Excluding food and energy
- 116.98 ÷ 113.79 = 1.02803
- 2.803% → 2.8%
Excluding agricultural products and oils
- 119.22 ÷ 116.00 = 1.02776
- 2.776% → 2.8%
The gap before rounding
- October: 2.803 − 2.776 ≈ 0.03 pp between the two core measures; both published as 2.8
- August: 116.64 ÷ 112.84 → 3.368%, 118.42 ÷ 114.84 → 3.117%
- August's 0.25 pp gap is published as 3.4 versus 3.1, or 0.3 pp
Index levels from the p. 2 tables of the Ministry of Data and Statistics releases for October 2026 (3 November 2026) and August 2026 (2 September 2026), 2020 = 100. Rounding half up to one decimal place reproduces all six published rates.
Using the index levels in Consumer Price Trends, August 2026 (in Korean, released 2 September 2026), August works out at 116.64 ÷ 112.84, or 3.368%, excluding food and energy, and 118.42 ÷ 114.84, or 3.117%, excluding agricultural products and oils. The gap before rounding is 0.25 points, but the published 3.4% and 3.1% make it look like 0.3. Every rate recomputed here from the index levels matches the published figure when rounded half up.
Month on month, they split again
October on its own looks different again. The all-items index rose 0.2% from September, while both core indices rose 0.4%. From the index levels, that is 0.249% for all items, 0.386% excluding food and energy, and 0.430% excluding agricultural products and oils. Prices fell among the items the core indices leave out. Agricultural products fell 3.9% during the month and pulled the all-items monthly change down by 0.15 points, with vegetables down 11.9%. Oil products rose 0.2% in the same month, contributing 0.01 points.
So October's 0.2% for all items was held down by cheaper vegetables, and prices without those swings rose 0.4% that month. Month-on-month changes are not seasonally adjusted, so one month says little about a trend, but you can see at once which way all items and the core measures moved apart.
How to read the three lines next time
According to the schedule in the release, Consumer Price Trends for November 2026 comes out on Wednesday 2 December. The Ministry plans to publish a revised index in December with items and weights updated to a 2025 base, and says the figures published on the 2020 base may change. The item counts used here, 458, 309 and 401, belong to the 2020-based index.
At the next release, read the three lines in this order. If all items run above both core measures, the excluded items such as agricultural products and oil pushed prices up; if all items run below, they pulled prices down. If the two core measures differ by 0.1 to 0.3 points, first compute the unrounded rates from the index levels, and if a gap remains, look at the items only one index keeps, such as livestock, processed food and electricity.
Add your perspective.
Share a question, another approach, or something you have tried.
Checking sign-in…
Loading comments…