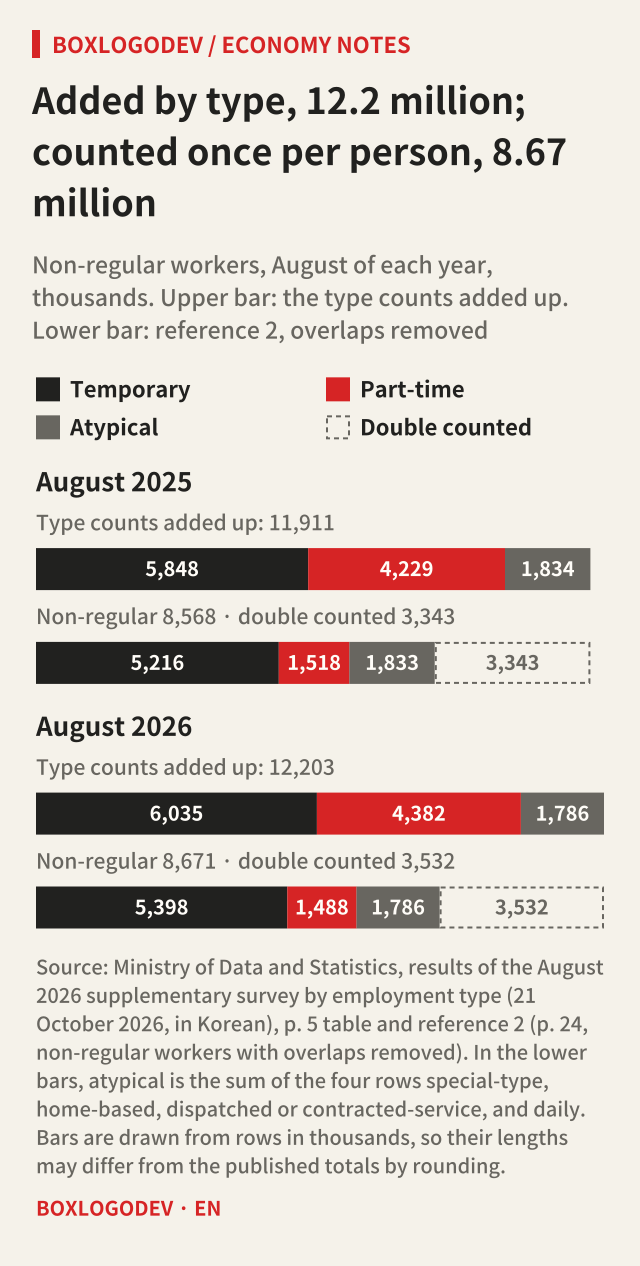
On 21 October 2026 Korea's Ministry of Data and Statistics released the results of its August 2026 supplementary survey by employment type (part of the Economically Active Population Survey, in Korean). It counted 8.671 million non-regular workers, 38.5% of 22.526 million wage workers. The same table lists 6.035 million temporary workers, 4.382 million part-time workers and 1.786 million atypical workers. Those three add up to 12.203 million, which is 3.532 million more than the non-regular total.
After reading this you will be able to check from the release's own tables why the two numbers differ, work out which group the double counting comes from, and take a sentence such as "part-time workers rose by 152,000" apart one more step. The figures were read from the release PDF on 9 November 2026.
Three groups, three different questions
The glossary in the release's appendix divides non-regular workers into temporary, part-time and atypical workers. The Bank of Korea's glossary of 800 economic and financial terms (2026 edition, in Korean) describes the same three groups in its entry on temporary workers (p. 367), and its entry on regular and non-regular work (p. 284) notes that "regular" is not a legal concept: it is understood as open-ended, full-time employment. In the statistics, each of the three groups asks a different question.
- Temporary: does the employment contract have a fixed term (fixed-term workers)? Or, without a fixed term, does the person keep working through repeated renewals, or can they not expect to stay for involuntary reasons such as the end of a contract or the completion of the work (non-fixed-term workers)?
- Part-time: are the scheduled working hours shorter, even by one hour, than those of workers doing the same kind of work at the same workplace? Normally being scheduled for under 36 hours a week puts someone here.
- Atypical: is the way of working different, as for dispatched, contracted-service, special-type, home-based and daily (short-term) workers?
Contract length, working hours and the employment arrangement are asked separately, so one person can answer yes to more than one. As a fictional example, someone on a one-year contract working 20 hours a week is both temporary and part-time. Someone employed by a cleaning contractor on a six-month contract to clean another company's building is both atypical (contracted service) and temporary. The 8.671 million non-regular workers count such a person once; the group counts count them once in each group they belong to. The release's notes and the footnote to its table also say that the non-regular total does not match the sum of the groups.
Two similar-sounding numbers are worth keeping apart. The monthly employment trends count of employed persons working under 36 hours covers everyone employed, including non-wage workers such as the self-employed, by the hours worked in the survey week (the week containing the 15th of each month). It is not the same group as part-time workers, who are defined by their scheduled hours. And the "Temporary Workers" figure the Ministry supplies to the OECD (reference 1 of the release), 6.345 million, combines fixed-term, "short-term expectation", dispatched and daily workers and leaves out workers on repeatedly renewed contracts (the note to reference 1), so its scope differs from the 6.035 million temporary workers.
Subtracting 8.671 million from 12.203 million
6,035 + 4,382 + 1,786 = 12,203 thousand, and 12,203 − 8,671 = 3,532 thousand. Those 3.532 million are not people but extra counts. A person in two groups is counted once more, and a person in all three is counted twice more. The shares show the same thing. Of non-regular workers, 69.6% are temporary, 50.5% part-time and 20.6% atypical, which adds up to 140.7%. 12,203 ÷ 8,671 is also 140.7%.
The same rule applies inside the atypical group. The p. 9 table lists 258,000 dispatched, 476,000 contracted-service, 566,000 special-type, 431,000 daily and 101,000 home-based workers. They add up to 1.832 million, but there are 1.786 million atypical workers.
The order that removes the overlaps
Reference 2 of the release (p. 24) carries a separate table that puts each overlapping person in a single group. The order runs from the most to the least non-regular: (1) special-type work, (2) home-based work, (3) dispatched or contracted-service work, (4) daily work, (5) temporary, (6) part-time. Each person goes once into the first box they match in this order.
For August 2026 the results are special-type 566,000 (6.5%), home-based 101,000 (1.2%), dispatched or contracted-service 734,000 (8.5%), daily 385,000 (4.4%), temporary 5.398 million (62.2%) and part-time 1.488 million (17.2%). The six rows add up to 8.672 million, one thousand off the published 8.671 million because each row is rounded to the thousand. Set against the group counts, this table shows where the overlaps are.
- The four atypical rows add up to 1.786 million, the same as the atypical count. Coming first in the order, the atypical group as a whole loses no one.
- Temporary goes from 6.035 million to 5.398 million. The 6,035 − 5,398 = 637 thousand are temporary workers who are also atypical.
- Part-time goes from 4.382 million to 1.488 million. The 4,382 − 1,488 = 2,894 thousand, 66.0% of part-time workers, are also counted as temporary or atypical.
637 + 2,894 = 3,531 thousand, which matches the 3,532 thousand from the subtraction within rounding. How many people belong to two or more groups is still not exact, though. The release document (PDF) does not give the number in all three groups, so its figures only say it is somewhere between 2.894 million and 3.531 million. Nor do its tables split the 2.894 million between those who are also temporary and those who are also atypical.
ECONOMY NOTES
The order that puts each person in one box
Reference 2 puts each person once, in the first type they match in the order special-type → home-based → dispatched or contracted-service → daily → temporary → part-time. August 2026, thousands
Atypical, four rows: special-type → home-based → dispatched or contracted-service → daily
- 566 + 101 + 734 + 385 = 1,786
- Equal to the 1,786 atypical workers. As a group, coming first, they lose no one
- Daily workers fall from 431 to 385: 46 were already counted in another atypical type
Temporary
- Type count 6,035 → overlaps removed 5,398
- 6,035 − 5,398 = 637 temporary workers who are also atypical
Part-time
- Type count 4,382 → overlaps removed 1,488
- 4,382 − 1,488 = 2,894 part-time workers also counted as temporary or atypical, 66.0% of part-time
Checking the sums
- 1,786 + 5,398 + 1,488 = 8,672, one thousand off the published 8,671 by rounding
- 637 + 2,894 = 3,531, matching 12,203 − 8,671 = 3,532 within rounding
- People in two or more types: between 2,894 and 3,531. The release document (PDF) does not give how many are in all three
Source: Ministry of Data and Statistics, results of the August 2026 supplementary survey by employment type (21 October 2026, in Korean), tables on pp. 5 and 9 and reference 2 (p. 24). The subtractions and the range are this article's calculation.
Taking apart "part-time workers rose by 152,000"
The release summary says that over the year temporary workers rose by 187,000 and part-time workers by 152,000, while atypical workers fell by 48,000. Those three changes add up to 291,000, yet non-regular workers rose by 103,000.
Comparing with the August 2025 values in reference 2 gives a different picture. Part-time workers who fit no other group fell from 1.518 million to 1.488 million, down 30,000. Take them out of all part-time workers and the part-time workers who overlap with another group rose from 2.711 million to 2.894 million, up 183,000. From the published changes it is 152,000 + 30,000 = 182,000; the gap is rounding. In net terms, the whole of the year's increase in part-time workers came from people who are part-time and also temporary or atypical. The double count itself rose by 189,000, from 3.343 million to 3.532 million.
That does not mean part-time work shrank. Wage workers with short scheduled hours rose by 152,000 over the year, and the part-time row in reference 2 counts only those among them who fit no other group. The two sentences count different things.
ECONOMY NOTES
Splitting the rise of 152,000 part-time workers
August 2025 → August 2026, thousands. The first two cards are published values; the last two add this article's calculations from them
All part-time workers (p. 5 table)
- 4,229 → 4,382, published change +152
Part-time workers in no other type (reference 2)
- 1,518 → 1,488, −30
Part-time workers who overlap (all − reference 2)
- 2,711 → 2,894, +183
- From the published changes: 152 + 30 = 182
- Share of part-time workers: 64.1% → 66.0%
All non-regular workers
- Type changes added up: 187 + 152 − 48 = 291
- Non-regular workers: 8,568 → 8,671, +103
- Double counted: 3,343 → 3,532, +189
Source: Ministry of Data and Statistics, results of the August 2026 supplementary survey by employment type (21 October 2026, in Korean), p. 5 table and reference 2 (p. 24). 152 is the published change (153 from the levels in thousands). 183 comes from levels and 182 from the published changes, so they differ by rounding.
The next figures come in 2027
The supplementary survey by employment type has been run once a year, in August, since 2017; from 2007 to 2016 it was run twice a year, in March and August. This year's results came out on 21 October, two months after the survey, and the Ministry's November 2026 release plan (checked on 9 November) does not include it. The next results will be from the August 2027 survey, so the figures here are still the latest on 16 November 2026.
The release said respondent-level data (microdata) would be provided through MDIS, the national microdata service, in November 2026. The MDIS provision schedule, read on 10 November, also lists it for November, with no provision date yet; last year's August file came out on 27 November. If the file carries the items on contract length, working hours and employment arrangement, it lets you count the overlaps the release document's tables leave unsplit: how many people are in all three groups, and whether the 2.894 million overlap with temporary or with atypical work.
When you meet a figure by group in non-regular work statistics, first check whether it is a group count or, like reference 2, a count that puts each person in one box only. Group counts and their shares do not add up to the non-regular total, and to compare changes between groups you need the deduplicated table in reference 2 alongside them.
Add your perspective.
Share a question, another approach, or something you have tried.
Checking sign-in…
Loading comments…