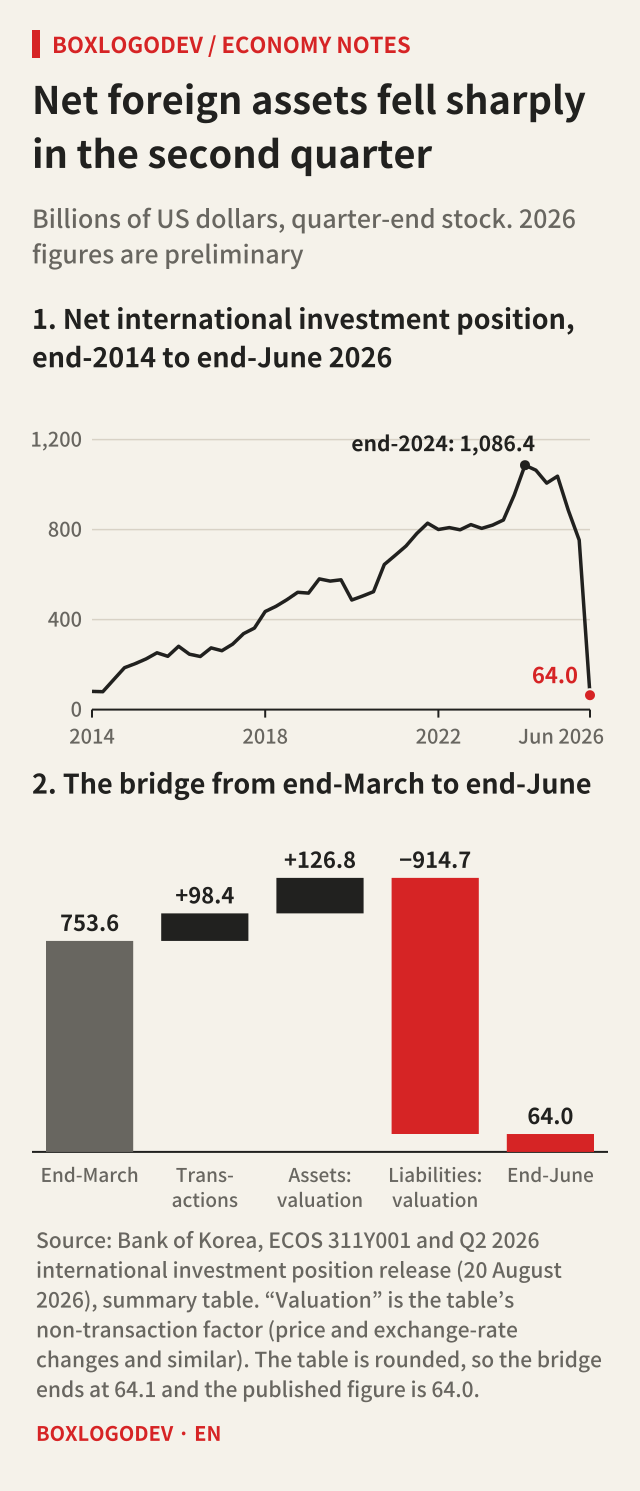
The Bank of Korea’s preliminary international investment position for the second quarter of 2026, released on 20 August 2026, puts Korea’s net position at $64.0 billion at the end of June. That is down $689.5 billion from $753.6 billion at the end of March. In the same quarter the current account was in surplus by $116.63 billion. With that much earned abroad, why did net foreign assets fall by so much more?
After reading this you will be able to split the $689.5 billion yourself from one table, tell changes caused by transactions from changes caused by shifting values, and judge whether the figure means Korea’s debt went up.
Rebuilding it from one table
From here on, amounts without a dollar sign are in the table’s unit, $100 million (so 7,536 means $753.6 billion), and the 2026 figures are preliminary. The net position is what residents hold abroad minus what non-residents hold in Korea, the external liabilities. For the end of March that is 28,826 − 21,290 = 7,536. For the end of June, 30,843 − 30,202 = 641, but the table says 640. The release notes that all figures are rounded, so totals may not add up. The published figure is 640.
Over the three months assets rose 2,017 and liabilities rose 8,912, so 2,017 − 8,912 = −6,895. So far this is subtraction. The next columns of the table are what matter. They split each change into a transaction factor (purchases and sales, loans and so on) and a non-transaction factor (price and exchange-rate changes and so on). For assets that is 749 and 1,268. For liabilities it is −235 and 9,147.
Subtracting again for the net position, transactions give 749 − (−235) = +984 and non-transaction factors give 1,268 − 9,147 = −7,879. They add up to −6,895, the published change. On transactions alone, the second quarter was a quarter in which the net position rose by $98.4 billion.
ECONOMY NOTES
Rebuilding the $689.5 billion from one table
End-March vs end-June 2026 · $100 million units, as in the table · preliminary
External assets
28,826 → 30,843 (+2,017)- Transactions +749; non-transaction +1,268
- What residents added, and what values did
External liabilities
21,290 → 30,202 (+8,912)- Transactions −235; non-transaction +9,147
- Transactions cut it; the stock still grew
Net position = assets − liabilities
2,017 − 8,912 = −6,895- Transactions: 749 − (−235) = +984
- Non-transaction: 1,268 − 9,147 = −7,879
Flow statistics for the same quarter
- Current account +1,166.3
- Financial account, net assets +1,032.4
- Each is less than a fifth of 6,895
Source: Bank of Korea, Q2 2026 international investment position release (20 August 2026), summary table; June and March 2026 balance of payments releases; ECOS 301Y013. The Q2 financial account is this article’s calculation: January–June 1,686.6 minus January–March 654.2.
Where did the current account surplus go?
The current account is a flow over a quarter; the net position is a stock at the end of it. The balance of payments is double-entry, so money coming in through a current account surplus generally shows up as a net increase in assets in the financial account. In the table’s $100 million units, the financial account for the second quarter shows a net asset increase of 1,032.4, which is January–June 1,686.6 minus January–March 654.2. That subtraction is this article’s calculation. The result sits about 134 below the current account figure of 1,166.3. On ECOS balance of payments figures the second-quarter capital account was only −1.9, and most of the difference is errors and omissions of −131.9, a line the release’s table does not show.
There is also a gap of about 48 between the financial account’s 1,032.4 and the 984 transaction factor in the investment position table, and lining the two up item by item traces it to derivatives. In the balance of payments, financial derivatives were a net asset increase of 48.4 in the second quarter (January–June 127.4 minus January–March 79.0), while the investment position table shows a dash in the transaction column for derivatives and puts their whole change under non-transaction factors. The other items nearly match: direct investment 128, portfolio investment 655, other investment 193, reserve assets 7. The release does not spell this out; the comparison is this article’s calculation.
These gaps are small beside the main result. The flow statistics show a plus of around 1,000; the stock fell 6,895. The release itself warns that the investment position includes valuation changes from exchange rates and share prices, so it can differ from the accumulated financial account flows. In this quarter that difference was far larger than the flow. A longer view says the same. On ECOS quarter-end figures the net position fell 10,224 ($1,022.4 billion), from 10,864 at the end of 2024 to 640 at the end of June this year, while the current account added up to a surplus of 3,140.6 ($314.06 billion) over those six quarters.
Why does a share rally raise a “liability”?
Korean shares bought by foreign investors are, from Korea’s side, an external liability, and the investment position values end-of-period stocks at market prices. So in a made-up example, if foreign investors hold $100 of Korean shares and the price doubles, the liability becomes $200 although no new money came in. The numbers in that example are invented.
In the actual table, in $100 million units, portfolio equity liabilities rose 8,481, from 10,325 to 18,806. Transactions were −639 and the non-transaction factor +9,120. Foreign investors were net sellers in the second quarter, and the stock still grew by more than 80%. The release attributes the expansion of this item to the rise in domestic share prices. The same release shows the KOSPI index up 67.8%, from 5,052.5 to 8,476.5, and the won down 1.8% against the dollar, from 1,513.4 to 1,541.5 won per dollar.
Of the 9,147 non-transaction factor on the liabilities side, 9,120, or 99.7%, is this one item. Residents’ foreign equity also rose 1,252 through non-transaction factors on the assets side, but that was too small to offset the liability. This item’s share of external liabilities went from 48.5% to 62.3% in three months.
An index estimate leaves $243.9 billion unexplained
You can test whether the KOSPI alone produces the 9,120 ($912.0 billion). The multiple in dollars is the KOSPI index ratio times the exchange-rate ratio (won per dollar): 8,476.5 ÷ 5,052.5 × 1,513.4 ÷ 1,541.5 = 1.6471. If the end-March holdings had moved exactly with the index, the valuation gain would be 10,325 × 0.6471 ≈ 6,681 ($668.1 billion). The published 9,120 is 2,439 larger ($243.9 billion), and it is a rise of 88.3% on the end-March holdings.
The release does not give a reason for the gap. It could arise if the shares foreign investors hold rose more than the index, but that is this article’s guess and this release cannot confirm it. What the estimate shows is that “because the KOSPI rose” points in the right direction, but one index does not reproduce the amount.
ECONOMY NOTES
Foreign investors were net sellers, and the liability rose
Portfolio equity liabilities, end-March vs end-June · $100 million units
The published table
10,325 → 18,806 (+8,481)- Transactions −639; non-transaction +9,120
- Net selling, yet the stock grew
A rough estimate from the index
8,476.5 ÷ 5,052.5 × 1,513.4 ÷ 1,541.5 = 1.6471- A dollar multiple: KOSPI gain and weaker won together
- 10,325 × 0.6471 ≈ 6,681
The gap to the published figure
9,120 − 6,681 = 2,439- The index alone does not explain this part
- The release gives no reason for the gap
Net external claims barely moved
- Net external claims: 3,655 → 3,678 (+23)
- Shares are not in the external debt statistics
- External debt +384; equity and derivatives +8,527
Source: Bank of Korea, Q2 2026 international investment position release (20 August 2026), table and reference box on page 2, and the external debt summary. The rough estimate is this article’s own; it assumes holdings at the start of the quarter moved exactly with the index and is not an official breakdown.
Does it mean Korea’s debt went up?
Mostly not. External debt did rise, but debt is not what produced this fall. The release’s reference table shows that, in $100 million units, of the 8,912 rise in liabilities, equity and derivatives account for 8,527 and external debt for 384 (these add up to 8,911 because of rounding). The external debt statistics cover only assets and liabilities with a fixed maturity, interest rate or repayment amount, so shares are not in them. External debt rose 384 while external claims rose 407, so net external claims, external claims minus external debt, rose 23 over the same period, from 3,655 to 3,678.
Nor do these statistics say all is well. In the release’s external claims and debt table, short-term external debt as a share of reserve assets rose 3.1 percentage points to 46.5%. Foreign-held shares carry no fixed repayment, but the holders can sell and leave, and these statistics do not measure the size of that risk. That sentence is this article’s reading. And because the stock is valued at market prices, a fall in share prices would shrink the liability by the same route. Such an “improvement” would have nothing to do with money earned either.
Three checks when you read about net foreign assets
First, flow or stock? The current account and financial account are flows; the investment position is a stock. Second, transactions or valuation? Look first at the two columns for transaction and non-transaction factors in the release’s summary table. Third, equity or debt? When you hear that external liabilities rose, find the external debt and net external claims lines as well.
For this quarter, in the table’s $100 million units, writing “transactions +984, non-transaction −7,879, net external claims +23” beside the fall of 6,895 shows most of what happened. The sources are the Bank of Korea’s Q2 2026 international investment position release (in Korean), its June 2026 and March 2026 balance of payments releases (in Korean) and ECOS tables 311Y001 and 301Y013, read on 1 November 2026. This article uses the second-quarter current account so that it matches the stock. It is preliminary and may be revised, and any revision after the 1 November reading is not reflected. The September balance of payments, which the Bank of Korea’s schedule lists for 5 November, completes the third-quarter current account, but this article leaves it out because the matching end-September stock is not out yet. The third-quarter investment position, which holds that stock, is on the schedule for 19 November at noon Korea time.
Add your perspective.
Share a question, another approach, or something you have tried.
Checking sign-in…
Loading comments…