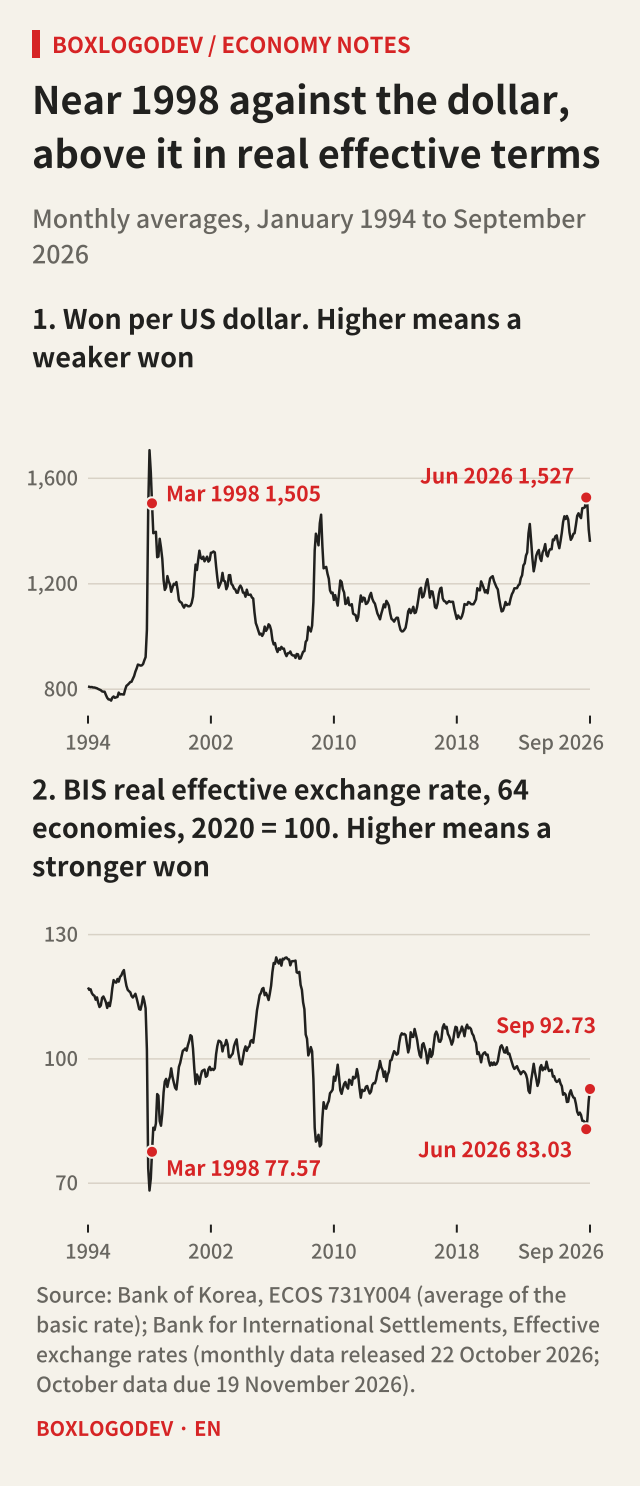
In June 2026 the won averaged 1,527.30 per US dollar. In the Bank of Korea’s ECOS data since 1994, the only monthly averages above that are January 1998 (1,706.80) and February 1998 (1,623.06), and it is also above the 1,505.28 of March 1998. So was the won in June weaker than just after the 1997 currency crisis? The answer depends on the ruler.
After reading this you will be able to compute a real exchange rate against the dollar yourself, see why nominal and real, and one currency and a basket, can give different answers, and no longer mix up whether a rising real effective exchange rate means a stronger or a weaker won.
Against the dollar alone, it was weaker
Start with nominal. The won’s value is the inverse of the exchange rate, so 1,505.28 ÷ 1,527.30 = 0.9856, or 1.4% lower than in March 1998. Saying the rate is 1.5% higher describes the same fact; the base differs, so the number differs slightly.
Now add prices. Korea’s consumer price index (2020 = 100) went from 61.349 to 119.99, a ratio of 1.9559. The US CPI-U (1982–84 = 100, not seasonally adjusted) went from 162.2 to 333.952, a ratio of 2.0589. A currency whose country has more inflation has strengthened in real terms even at an unchanged exchange rate, so multiply by one ratio and divide by the other.
0.9856 × 1.9559 ÷ 2.0589 = 0.9363. Against the dollar, the won’s real value was 6.4% below March 1998. US prices rose more than Korean prices over the period, so adding prices widens the gap. “In real terms it is not as bad as back then” does not hold, at least on the dollar alone. This calculation is this article’s own and not an official statistic. The two countries’ price indices have different baskets, and those baskets changed over 28 years, so read it as an approximation.
ECONOMY NOTES
One currency, with prices added
June 2026 compared with March 1998 · exchange rates are monthly averages
Inputs
- Won per dollar: 1,505.28 → 1,527.30
- Korea CPI (2020 = 100): 61.349 → 119.99
- US CPI-U (1982–84 = 100): 162.2 → 333.952
Nominal: the won's value in dollars
1,505.28 ÷ 1,527.30 = 0.9856- The won was worth 1.4% less
- The rate itself is 1.5% higher (the base differs)
Price ratios
- Korea: 119.99 ÷ 61.349 = 1.9559
- US: 333.952 ÷ 162.2 = 2.0589
- US prices rose more than Korean prices over the period
Real: the won's value against the dollar
0.9856 × 1.9559 ÷ 2.0589 = 0.9363- 6.4% lower
- Against the dollar alone, adding prices leaves it weaker than March 1998
Source: Bank of Korea, ECOS 731Y004 (average of the basic rate); Ministry of Data and Statistics consumer price index (ECOS 901Y009); US Bureau of Labor Statistics CUUR0000SA0, not seasonally adjusted. The real calculation is this article’s own, not an official statistic.
Against a basket, it was stronger
Korea does not trade only in dollars. An effective exchange rate prices the won against a whole basket of currencies, with each partner’s share set by its trade with Korea. The Bank for International Settlements (BIS) first takes a geometric average of the individual rates using those trade shares to get the nominal index, then brings in consumer price differences between countries to get the real index. The weights come from manufacturing trade, include third-market competition and change on a three-year basis. The broad basket has 64 economies, the narrow real basket 27, and the indices are set so that the 2020 average is 100.
Put the same two months on this ruler and the answer flips. The broad real effective rate was 77.57 in March 1998 and 83.03 in June 2026, 7.0% higher. The nominal effective rate went from 79.66 to 81.99, 2.9% higher, and the narrow real effective rate from 69.68 to 82.94, 19.0% higher. All three say the won in June was stronger than in March 1998.
Why? First, the dollar’s share is smaller than you might assume. In the BIS weights file, Korea’s broad basket in 1996–98 was US 23.1%, Japan 21.7%, euro area 15.3%, China 10.0%. In the latest set, 2020–22, it is China 32.6%, euro area 13.0%, Japan 12.4%, US 11.5%. Second, the currencies in the basket do not move together. In nominal terms the won was 23.1% stronger against the yen, with 100 yen going from 1,169.98 to 950.38 won, and 19.4% weaker against the yuan, from 181.82 to 225.51 won. This article did not unpack all 64 currencies, though, so it does not say which ones produced the +7.0%.
The price part also runs the opposite way from the dollar case. The real effective rate divided by the nominal one rose 4.0%, from 0.9738 in March 1998 to 1.0127 in June 2026, and 1.0292 × 1.0400 = 1.0704, which matches the 7.0%. Across the basket, this can be read as Korean prices having risen more than the weighted average of its partners. That split and reading are this article’s own, an approximation from rounded indices.
ECONOMY NOTES
The same two months, a different answer on each ruler
The won in June 2026 compared with March 1998
Against the dollar: weaker
- Nominal −1.4%
- Real −6.4% (this article’s calculation)
Against a basket: stronger
- BIS nominal effective 79.66 → 81.99, +2.9%
- BIS real effective 77.57 → 83.03, +7.0%
- Narrow basket, real 69.68 → 82.94, +19.0%
Currencies in the basket differ (nominal)
- 100 yen: 1,169.98 → 950.38 won: +23.1% against the yen
- 1 yuan: 181.82 → 225.51 won: −19.4% against the yuan
The dollar's share has shrunk (BIS broad weights)
- 1996–98: US 23.1%, Japan 21.7%, euro area 15.3%, China 10.0%
- 2020–22: China 32.6%, euro area 13.0%, Japan 12.4%, US 11.5%
Source: BIS Effective exchange rates (monthly; broad basket 64 economies, narrow 27) and weights file; Bank of Korea, ECOS 731Y004. The percentage changes are this article’s calculations.
Two things that are easy to read backwards
The first is direction. For won per dollar, a higher number means a weaker won. For the BIS effective rates, a higher number means a stronger won. June to September 2026 is a good example. The monthly average rate went from 1,527.30 to 1,359.00, down 11.0%, which raises the won’s value by 12.4%. Over the same three months the real effective rate rose 11.7%, from 83.03 to 92.73. One number fell and the other rose, and they tell the same story.
The second is what 100 means. It is only the 2020 average. A reading of 83.03 means almost 17% below the 2020 average, not that the won is 17% undervalued against some fair level. Nothing in the index says 2020 was fair. The Bank of Korea’s glossary of economic and financial terms (2026, pages 206–207, in Korean) describes a rising index as overvaluation with weaker export price competitiveness, and a falling one as undervaluation with stronger competitiveness. This article reads that as a statement about direction. Its judgement is that a fair level cannot be obtained from this index alone.
For reference, the simple average of the 393 months since January 1994 is 101.9. The 83.03 of June 2026 was the lowest since March 2009 (79.33), and the 92.73 of September is the highest since November 2024. The low of the series is 68.24 in January 1998.
What this index cannot tell you
The BIS says effective exchange rates can serve as a measure of international competitiveness. But the weights come from manufacturing trade and the prices are consumer prices. Consumer prices include items that are not exported, so taking the index as a direct measure of export price competitiveness goes too far. That too is this article’s reading. Imported goods are also directly affected by the exchange rate of the currency they are paid in. For someone buying goods priced in dollars, the won-dollar figure may be closer to what matters than a rise in the real effective rate. The question is not which ruler is right but what you want to know.
Three checks when you read about the exchange rate
First, against what? One dollar, or which basket? Second, nominal or real? Are prices in it? Third, which way is up? Weaker for the exchange rate, stronger for the effective rate. When you hear “currency-crisis levels”, put the same two dates side by side on the nominal dollar rate, the real dollar rate and the real basket. For these two months those are −1.4%, −6.4% and +7.0%.
The sources are the BIS real effective exchange rate for Korea, broad basket, the exchange-rate and consumer-price tables in Bank of Korea ECOS (in Korean) and the US Bureau of Labor Statistics CPI-U, read on 1 November 2026. BIS monthly data run through the release of 22 October; October data are due on 19 November.
Add your perspective.
Share a question, another approach, or something you have tried.
Checking sign-in…
Loading comments…