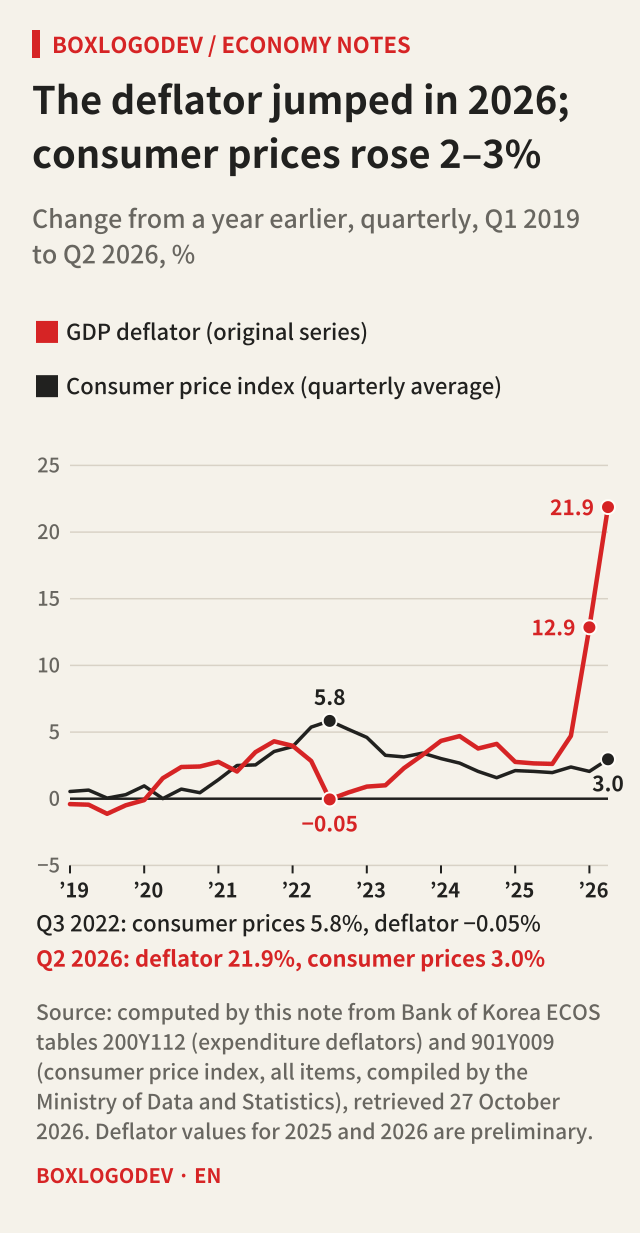
In its preliminary national income release for the second quarter of 2026, published on 8 September 2026, the Bank of Korea reported that real GDP was 3.7% higher than a year earlier while nominal GDP was 26.4% higher. The GDP deflator, which links the two, rose 21.9%. Export prices drove that rise: the export deflator was up 56.6%. Consumer prices in the same quarter rose about 3%. After reading this note you will be able to compute the deflator yourself from nominal and real growth, and know which lines of the release to check when the deflator and consumer prices drift far apart.
Match the basis first
Both 3.7% and 26.4% compare the original (not seasonally adjusted) series with the same quarter a year earlier. The 0.6% (real) and 9.2% (nominal) in the same release compare the seasonally adjusted series with the previous quarter, so the two kinds must not be mixed in one calculation. The 21.9% deflator figure is also a change from a year earlier in the original series.
On 27 October the Bank of Korea published its advance estimate of third-quarter real GDP. Real GDP grew 1.0% from the previous quarter and 3.4% from a year earlier. The advance estimate covers real measures only. Nominal GDP and the deflator come with the preliminary estimate, released within 70 days of the quarter’s end, and the Bank of Korea’s release calendar sets the third-quarter preliminary estimate for 8 a.m. on 9 December. On 27 October the Bank of Korea’s ECOS database also had the real GDP series up to the third quarter but the nominal GDP and deflator series only up to the second. So on 25 November, when this note goes out, the second-quarter deflator is still the latest.
The same advance estimate put real gross domestic income (GDI) 18.8% above a year earlier. Real GDI is real GDP plus the real trading gains or losses from changes in the terms of trade, so its wide gap with 3.4% means those trading gains grew a great deal from a year earlier. How much of that shows up in the deflator can be checked on 9 December.
The deflator is nominal divided by real
The Bank of Korea’s Korean-language glossary of 800 economic and financial terms (2026 edition) defines the GDP deflator as the value obtained by dividing nominal GDP by real GDP. Nominal GDP is valued at the prices of the time, so it mixes changes in quantity and in price. Real GDP is a volume measure valued at chained 2020 prices. Divide nominal by real and the quantities cancel, leaving the prices.
With the original-series amounts in ECOS, nominal GDP rose from 657.9 trillion won in the second quarter of 2025 to 831.8 trillion won in the second quarter of 2026, up 26.4%. Real GDP rose from 577.9 trillion won to 599.5 trillion won, up 3.7%. Nominal divided by real, times 100, gives a deflator that moves from 113.847 to 138.744 (2020 = 100). 138.744 ÷ 113.847 = 1.219, a rise of 21.9%.
When only the growth rates are known, the calculation is the same. Add 1 to each and divide: 1.264 ÷ 1.037 = 1.219. Subtracting 3.7 from 26.4 gives 22.7, which is 0.8 points too high. Multiply back and 1.037 × 1.219 = 1.264, where the product of the two rates, 0.037 × 0.219 ≈ 0.008, slips in. Subtraction loads that bit onto the deflator. When both rates are 1–2% the bit is small and subtraction is close enough, but with a deflator above 20% and real growth of 3–4%, as here, the gap shows.
The Korean-language release notes that deflator changes are calculated from the index to three decimals, so recalculating from the one-decimal index printed in the release can give a different figure. Something similar happens with rounded growth rates. With values that round to 26.4% and 3.7%, adding 1 to each and dividing gives anything from 21.8% to 22.0%.
ECONOMY NOTES
Divide growth rates, don't subtract them
Q2 2026, original series, change from a year earlier
The three published figures
- Nominal GDP +26.4%
- Real GDP +3.7%
- GDP deflator +21.9%
Dividing gets it right
- 1.264 ÷ 1.037 = 1.219 → +21.9%
- The ECOS index agrees:
- 138.744 ÷ 113.847 = 1.219
Subtracting overshoots by 0.8 points
- 26.4 − 3.7 = 22.7
- Multiply back: 1.037 × 1.219 = 1.264
- Subtraction keeps the cross term
- 0.037 × 0.219 ≈ 0.008
The rounding range
- Values that round to 26.4% and 3.7% give 21.8% to 22.0%
- The published rate uses the index to three decimals
Source: Bank of Korea, GNI for Q2 2026 (preliminary), 8 September 2026; ECOS table 200Y112, retrieved 27 October 2026. Calculations are this note's.
Export prices pushed the 21.9% up
The Korean-language release also breaks the deflator down on the expenditure side. The domestic demand deflator, excluding changes in inventories, rose 3.6%, the export deflator 56.6% and the import deflator 21.0%. In the same quarter the won–dollar reference exchange rate (period average) rose 7.0% from a year earlier. GDP is consumption and investment plus exports minus imports. So higher export prices lift the deflator, and, with other prices unchanged, higher import prices pull it down.
The release does not break the deflator down into contributions by component, so this note made a rough estimate from the ECOS original series. For each component, last year’s second-quarter nominal amount times (1 + its real growth rate) gives this year’s quantities valued at last year’s prices. Subtract that from this year’s nominal amount and what remains is the increase due to price changes. For exports, 298.4 trillion won × 1.089 = 325.0 trillion won, while actual nominal exports were 508.9 trillion won, so the price effect is 183.9 trillion won.
Dividing by the four components valued at last year’s prices (682.5 trillion won in total) gives exports +26.9 points, imports −8.5 points, consumption +2.0 points and investment +1.4 points, for a sum of 21.8%. Unrounded, the sum is 21.83% against a 21.87% rise in the ECOS deflator index (published as 21.9%), a gap of 0.04 points, which comes from the statistical discrepancy outside the four components and from the fact that real amounts measured at chained prices do not add up exactly across components. This is the note’s own rough calculation, not an official breakdown by the Bank of Korea.
ECONOMY NOTES
A rough split of the 21.9% by component
This note's calculation, not an official breakdown. KRW trillion, original series
Method
- Price effect: this year's nominal
- minus last year's nominal
- × (1 + real growth rate)
- Contribution: price effect ÷
- the sum of the four components
- at last year's prices (682.5 trillion)
Exports +26.9 pp
- 298.4 × 1.089 = 325.0
- 508.9 − 325.0 = 183.9
- 183.9 ÷ 682.5 = 26.9 pp
The other three
- Imports (deducted) −58.2 → −8.5 pp
- Consumption +13.5 → +2.0 pp
- Investment +9.8 → +1.4 pp
- Sum 21.8 (published 21.9)
What households paid in the same quarter
- Consumer prices +3.0%
- (quarterly average)
- Household consumption deflator
- +3.1%
Source: ECOS tables 200Y109 (nominal), 200Y110 (real), 200Y112 and 901Y009, retrieved 27 October 2026. Consumption is final consumption expenditure; investment is gross capital formation. Unrounded, the sum is 21.83% against 21.87% from the ECOS index (published as 21.9%).
The release does not explain by product why the export deflator rose 56.6%, so this note does not go into it either. How to compare export and import prices is covered in a separate note on the terms of trade. The Total Output Price Index, a monthly index that adds export prices to producer prices, is covered in a note comparing producer prices with total output prices.
Why 21.9% does not mean “prices rose 21.9%”
The glossary also calls the GDP deflator the broadest measure of prices, since producer prices, consumer prices, export and import prices and wages are all used in estimating GDP. But what it prices differs from consumer prices. The consumer price index measures the prices of goods and services that households buy, and imported consumer goods are part of it. The GDP deflator measures the prices of what is produced in Korea, so the prices of exports sold abroad are in and the prices of imports are out.
That is why what households paid in the second quarter did not rise nearly as much. Consumer price inflation published by the Ministry of Data and Statistics was 2.6% in April, 3.1% in May and 3.2% in June, and the quarterly index in ECOS went from 116.32 to 119.76, up 3.0%. Within the national accounts, the household final consumption deflator rose 3.1%. The 21.9% is not the rise in what households buy but the price change of everything produced in Korea, and this time export prices drove it.
The gap has opened the other way too. By today’s ECOS indices, consumer prices in the third quarter of 2022 were 5.8% higher than a year earlier, while the GDP deflator barely moved (−0.05%). The same calculation puts that quarter’s import deflator up 29.5% and the export deflator up 15.0%. With import prices rising much faster than export prices, what households paid jumped while the deflator was held down.
A made-up small economy shows the mechanism on its own. It has three items, domestic use, exports and imports, and every year-1 price is 1. Suppose in year 2 the price of domestic use rises 3%, export prices 50% and import prices 20%. Real output goes from 110 to 113, up 2.7%, nominal output becomes 133.86, and the deflator rises 18.5%. Had export prices stayed flat, the deflator would instead have fallen 4.5%. Because the example is simplified to fixed prices, it does not match chain-linked official statistics exactly.
ECONOMY NOTES
A made-up three-item economy
Made-up numbers, simplified to fixed prices. Every year-1 price is 1
Year 1
- Domestic use 100 + exports 50 − imports 40
- Nominal = real = 110
Year 2 quantities and prices
- Quantities 102, 52, 41 → real 113 (+2.7%)
- Prices: domestic +3%, exports +50%, imports +20%
Deflator +18.5%
- Nominal = 102×1.03 + 52×1.5 − 41×1.2
- = 133.86
- 133.86 ÷ 113 = 1.185
- What is used at home costs only 3% more
If export prices had stayed flat
- Nominal = 105.06 + 52 − 49.2 = 107.86
- 107.86 ÷ 113 = 0.955 → −4.5%
- With other prices unchanged, dearer imports pull the deflator down
A made-up example. Real statistics measure volume with chained prices, so they do not add up as neatly as this.
A calculation for the 9 December release
When the preliminary third-quarter figures come out, first get the deflator by adding 1 to the nominal and real growth rates from a year earlier and dividing. Then look at three lines of the deflator table: domestic demand, exports and imports. If the domestic demand deflator is close to consumer prices and only the GDP deflator moved a lot, the difference came from export and import prices. Whether export prices rose more than import prices, or import prices fell, can only be told by reading the two lines together. The second quarter was the first case (exports 56.6%, imports 21.0%). Preliminary figures, the second quarter’s included, can be revised with the fourth-quarter release or when the annual national accounts are finalised.
Add your perspective.
Share a question, another approach, or something you have tried.
Checking sign-in…
Loading comments…